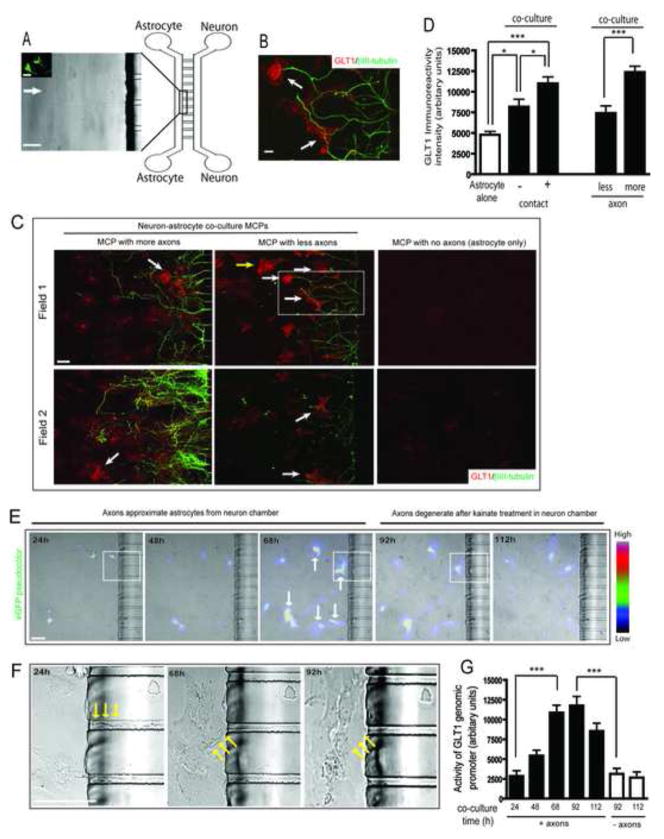
Figure 1. Axon-dependent transcriptional activation of GLT1 promoter and GLT1 protein expression on a microfluidic culture platform (MCP).
A. Diagram of an astrocyte neuron co-culture system using a microfluidic culture platform (MCP). Growth cone is stained with 2G13 antibody. Scale bar, 20μm (insert scale bar, 10μm). B. Magnified view of the interaction between axons and astrocytes. Astrocytes were stained with GLT1 and axons were stained with βIII-tubulin antibody. Scale bar, 50μm. C. Axons are sufficient to induce GLT1 up-regulation in cultured astrocytes on MCP. Astrocytes were stained with GLT1 and axons were stained with βIII-tubulin antibody. White arrow: astrocyte with axon contact; yellow arrow; astrocyte without axon contact; Representative two fields were shown from each group. Scale bar, 50 μm. D. Quantitative analysis of axon-induced GLT1 expression (5–10 astrocytes per field, 2–3 field/MCP from total 5–7 MCPs). E. Time-lapse recording of astrocytic eGFP (from BAC GLT1 eGFP mice) fluorescence and outgrowth of axons within MCP. Confocal images were collected 24h to 112h after co-culture. eGFP fluorescence intensity in astrocyte using pseudocolor represention (Image J). Kainate (200 μM) was added to the right side of MCP after taking images at 68h to induce neural injury and axon degeneration. The exchange of solution between chambers is very minimal. Direct treatment of kainite (200 μM) to astrocyte did not change GLT1 expression and astrocyte viability. Scale bar, 50 μm. F. Magnified view of axon and astrocyte interaction in MCP. Examples of axons (yellow arrow) that extend through MCP channels (24h–68h) and axonal degeneration after kainite treatment (68h–92h). Scale bar, 50 μm. G. Quantitative analysis of axon-dependent change of eGFP fluorescence intensity from time-lapse images (5–8 astrocytes per field, 2–3 fields/MCP from total 3–5 MCPs (*P<0.05, *** P<0.001, mean ± SEM, one-way ANOVA and Bonferroni posthoc analysis).

