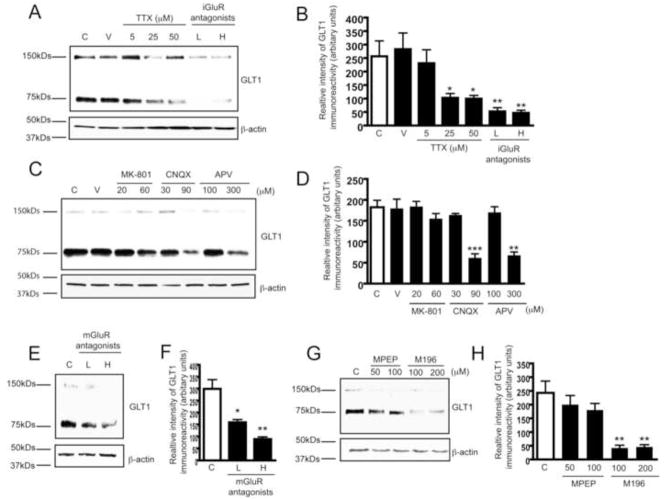
Figure 2. Glutamate receptors are involved in neuron-dependent GLT1 expression.
A. Dose-dependent reduction of GLT1 expression levels induced by TTX (5–50μM) and iGluR antagonist cocktail treatment (7d) in rat organotypic spinal cord slice cultures. L: low dose of cocktail (20μM MK801 + 30μM CNQX + 100μM APV); H: high dose of cocktail (60μM MK801 + 90μM CNQX + 300μM APV). B. Densitometric analyses of GLT1 immunoreactivity from immunoblot following seven day TTX or iGluR antagonist cocktail treatment (n=3). C. Effect of individual iGluR antagonists on neuron-dependent GLT1 expression. Rat spinal cord cultures were treated with individual iGluR antagonist for 7d. D. Densitometric analyses of GLT1 immunoreactivity from immunoblot with individual iGluR antagonist (n=3). E. Dose-dependent reduction of GLT1 expression levels induced by mGluR antagonist cocktail treatment (7d) in rat spinal cord slice cultures. L: low dose of cocktail (100μM M196 + 50μM MPEP); H: high dose of cocktail (200μM M196 + 100μM MPEP). F. Densitometric analyses of GLT1 immunoreactivity from immunoblot with mGluR antagonists cocktail treatment (n=3). G. Effect of individual mGluR antagonists on neuron-dependent GLT1 expression. Rat spinal cord slice cultures were treated with individual mGluR antagonists for 7d. H. Densitometric analyses of GLT1 immunoreactivity from immunoblot with individual mGluR antagonists (n=3). All the immunoblots were quantified in Quantity One software and plotted in PRISM (***, P<0.001, **, P<0.01, *, P<0.05, error bars represent SEM, one-way ANOVA and Bonferroni test was used).

