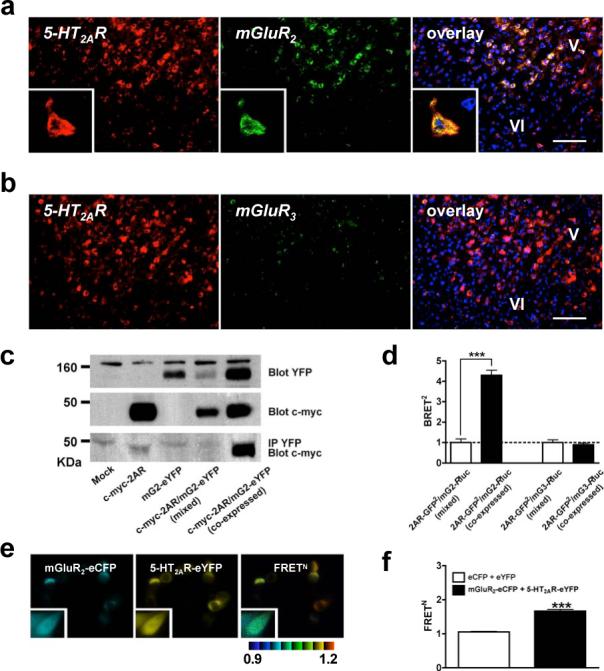
Figure 1. 2AR and mGluR2 co-localize and interact.

a, 2AR and mGluR2, but not mGluR3, co-express in neurons. Scale, top=50 μm, bottom=10 μm. Nuclei are blue. Inset: co-expressing neuron. b, FISH for mGluR3 in thalamus. Scale, top=25μm, bottom=10μm. c, mRNA levels by real-time PCR (n=6 per group). d, Specific co-immunoprecipitation of 2AR and mGluR2 in duplicate human cortex samples (arrows). e. BRET2 shows specific 2AR and mGluR2 interaction in HEK293 cells. Data are mean±s.e.m. (n=3). The mGluR2/2AR curve is preferably fitted by a saturation curve, F test (p<0.001). The other co-transfection datasets show linear correlations. f, [3H]Ketanserin displacement curves in mouse SCx membranes (top panels). 2AR agonist affinities were higher in the presence of mGluR2/3 agonist 10 μM LY379. [3H]LY341495 displacement curves (bottom panels). mGluR2/3 agonist affinities were lower in the presence of 2AR agonist 10 μM DOI.
