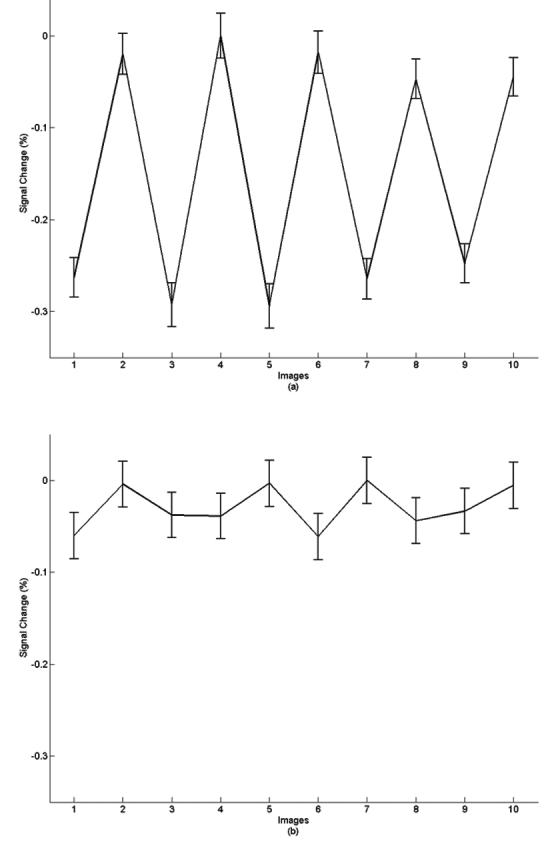
FIG. 4.

Time-course plots corresponding to the activated S1 area (a) and non-activated area (b) in 80ms latency effect scans. Odd numbers indicate stimulation On, even numbers represent the resting state. Each point on the time course represents an average of 120 images. The signal variance in activated S1 area was about 0.24% with good trial-by-trial consistency. The signal variance in the non-activated area is about 0.05%, and looks more random.
