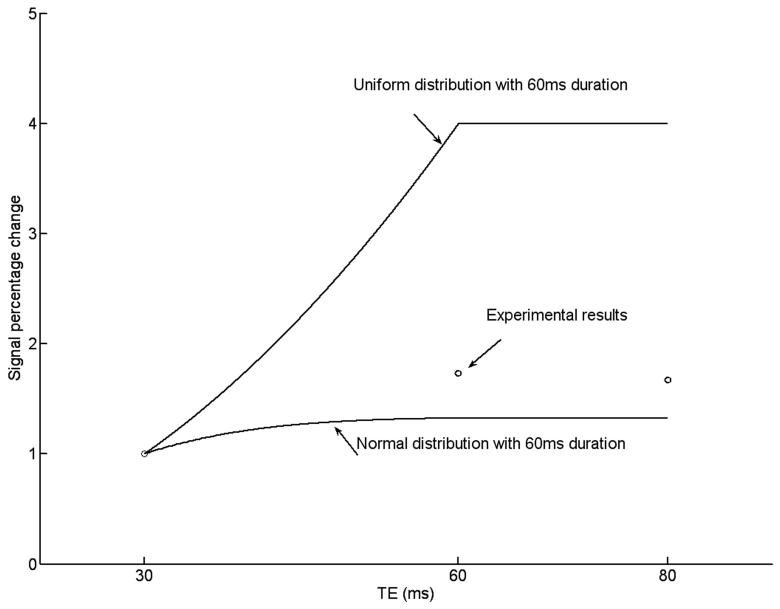
FIG. 8.
The signal percentage changes for different TEs and distributions. For the simulated data (solid line), a limited duration (60ms) of neuronal activity was assumed. No opposite neuronal magnetic field was considered. We assumed that the total number of neurons fired during the TE are same for both uniform and normal distributions. All data have been normalized to TE of 30 ms.. The TE was centered at P80 component (TE/2 was located at 80ms after stimulus).

