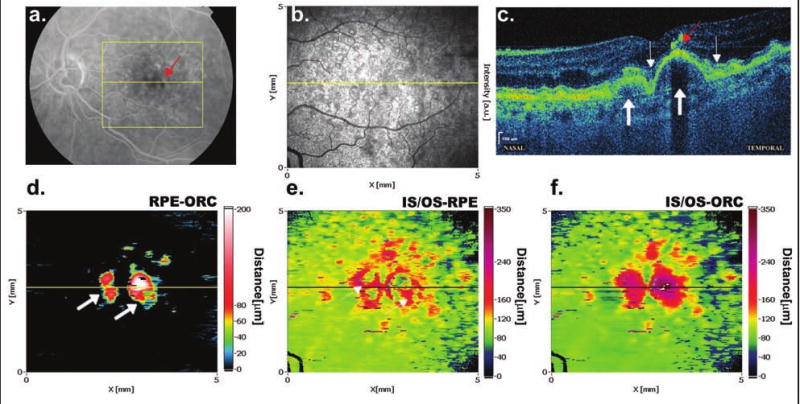
Figure 3.

Deposits under the RPE in the form of soft drusen in age-related macular degeneration. (A) The late phase of fluorescein angiography demonstrates large soft drusen in the center and small hard drusen in the periphery of the examined area (yellow lines). (B) Scattered hard drusen in the periphery are also visible on the SD-OCT fundus view. (C) Regular elevations of the RPE by homogenous material of low reflectivity visible in the spectral domain OCT image correspond to drusen (thick arrows). The places of increased separation between the IS/OS junction and RPE around drusen are marked (thin arrows). A small, highly reflective structure indicated by the red arrow is probably related to a pigment deposit visible on fluorescein angiography as a hypofluorescent spot (red arrow). (D) Regular, high elevations of the RPE due to drusen are visible on the RPE-ORC map (thick arrows). (E) The IS/OS-RPE map reveals concave areas of increased distance between the RPE and IS/OS junction around drusen (thin arrows). (F) The IS/OS-ORC map helps to assess the distribution of RPE elevations in respect to the IS/OS elevations.
