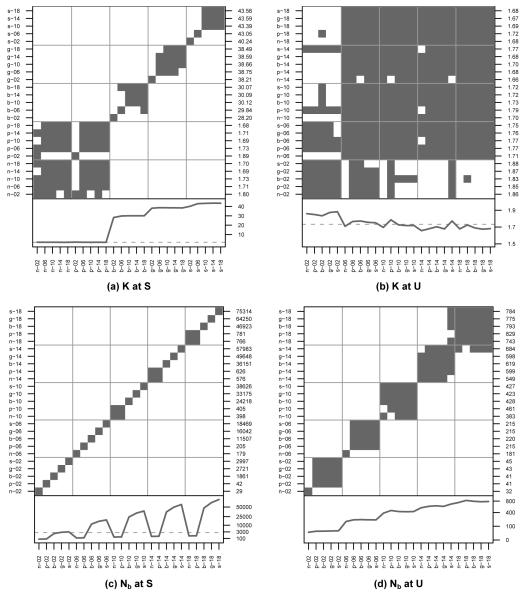
Figure 2. Comparisons of K and Nb at Loci S and U.
Identification of simulation pairs with significantly different means (white cells) of allelic diversity (a,b) and of neighborhood size (c,d) at the self-incompatibility locus, S, and the neutral marker unlinked to it, U. Note that the order of cells in (a) is different than the other subfigures. For the lower panels of (a) and (b), the dashed line is equal to 1.73, the expected neutral level of diversity. For the lower panels of (c) and (d), the dashed line is equal to 2500, or the total census size of the simulated population. See Figure 1 for more details on the layout of each subfigure.

