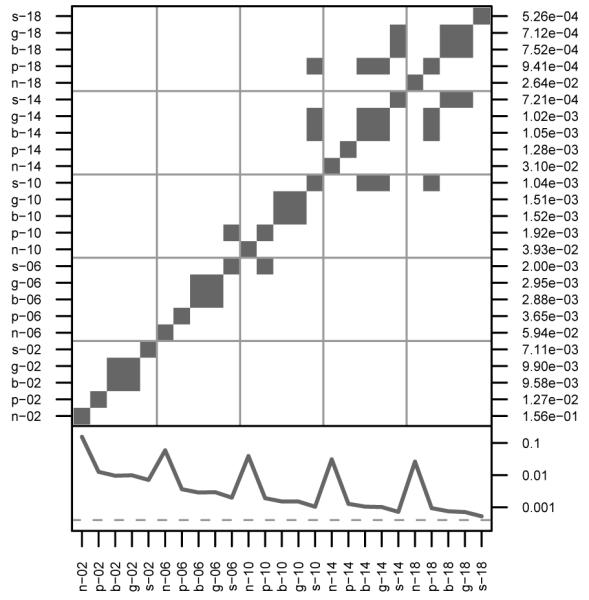
Figure 4. Comparisons of PIBD at Locus U.

Identification of simulation pairs with significantly different means of probability of IBD at unlinked locus U (white cells). In the lower panel, the solid line is approximately at 2/2500, the expected level under random mating. See Figure 1 for more details on the layout.
