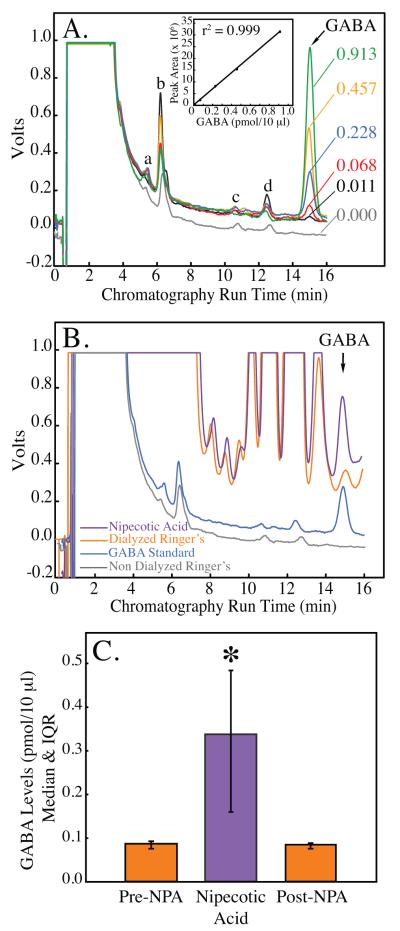
Figure 1.
Gamma aminobutyric acid (GABA) levels in cat pontine reticular formation are reliably quantified using in vivo microdialysis and HPLC. A. Known amounts of GABA were used to create a standard curve for each microdialysis experiment. Numbers to the right of each chromatogram indicate GABA concentration (pmol/10 μl). Peaks labeled “a to d” did not increase with increasing concentrations of GABA. B. The four traces show representative chromatograms obtained from non-dialyzed Ringer’s (gray trace), a GABA standard (0.228 pmol/10 μl; blue trace), and samples collected from the pontine reticular formation during in vivo microdialysis with Ringer’s (orange trace) and Ringer’s containing nipecotic acid (violet trace). The increase in peak area produced by nipecotic acid confirmed the presence of GABA in cat pontine reticular formation. C. GABA levels were significantly increased (290%) during dialysis delivery of the GABA uptake inhibitor nipecotic acid (NPA) to the pontine reticular formation, providing additional confirmation that the peak at 15 min represents GABA.

