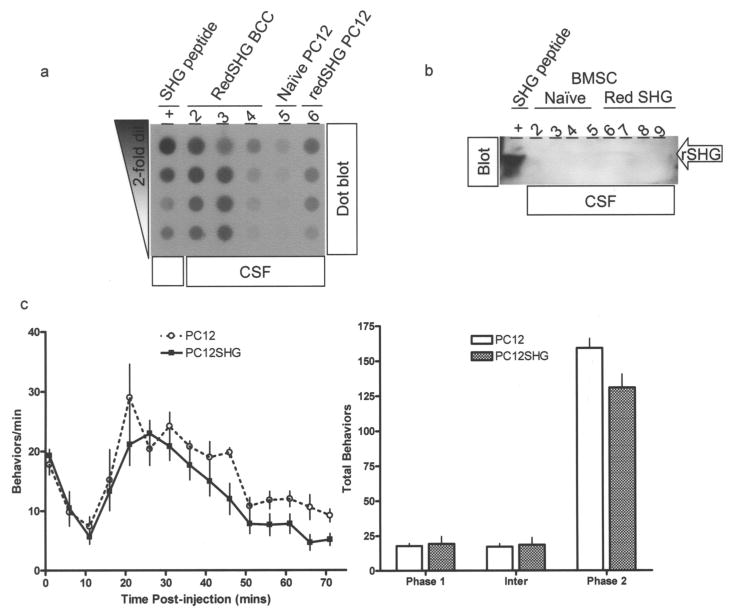
Figure 5.
Cerebrospinal fluid (CSF) samples collected from rats that received transplants as indicated were analyzed by dot blot (a) or Western blot (b). Samples are indicated above the image; in (b) arrow indicates the position of the SHG in CSF. (c) Effects of intrathecal (IT) transplants of PC12 cells on formalin-induced pain behaviors over time (left) and on total behaviors during phase 1 (0–1 min); interphase (6–11 min), and phase 2 (16–70 min) (right). Modest suppression of formalin-induced behaviors during phase 2 by red SHG PC12 cells compared to naive PC12 cells can be seen. No behavioral effect is seen in phase 1 or interphase. Data are expressed as mean ±SEM (n = 5–6/treatment group). p < 0.05.

