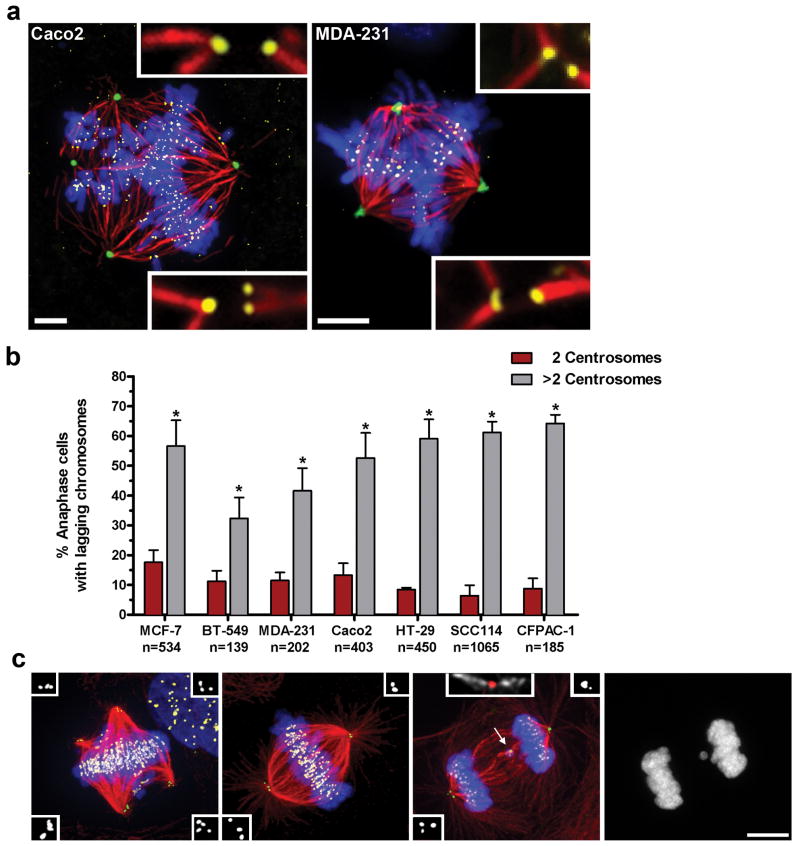
Figure 2. Extra centrosomes correlate with increases in lagging chromosomes.
a) Multipolar Caco2 and MDA-231 cells stained for pericentrin (green), microtubules (red), chromosomes (blue), and kinetochores (yellow). Merotelic attachments are shown in insets. Scale bars, 5 μm. b) The percentage of cancer cells with 2 (red) or >2 (grey) centrosomes that exhibit one or more lagging chromosomes during bipolar anaphase (n=number of anaphase cells counted; error bars represent mean ± SE from at least 4 independent experiments; asterisks denote P-values < 0.02 and are derived from an unpaired two-tailed t-test. c) Representative MCF-7 cells with extra centrosomes during prometaphase (multipolar spindle intermediate), metaphase (bipolar spindle with clustered centrosomes), and anaphase (with clustered centrosomes), stained for centrioles (green, and inset white), microtubules (red), chromosomes (blue), and centromeres (yellow). Arrow indicates a lagging chromosome caused by merotelic attachment, in which microtubules emanating from both poles attach to a single kinetochore (inset; microtubules white, centromere red). A detailed description of the criteria used for scoring lagging chromosomes can be found in Supp. Fig. 7. Scale bar, 10 μm.

