
Figure 8.
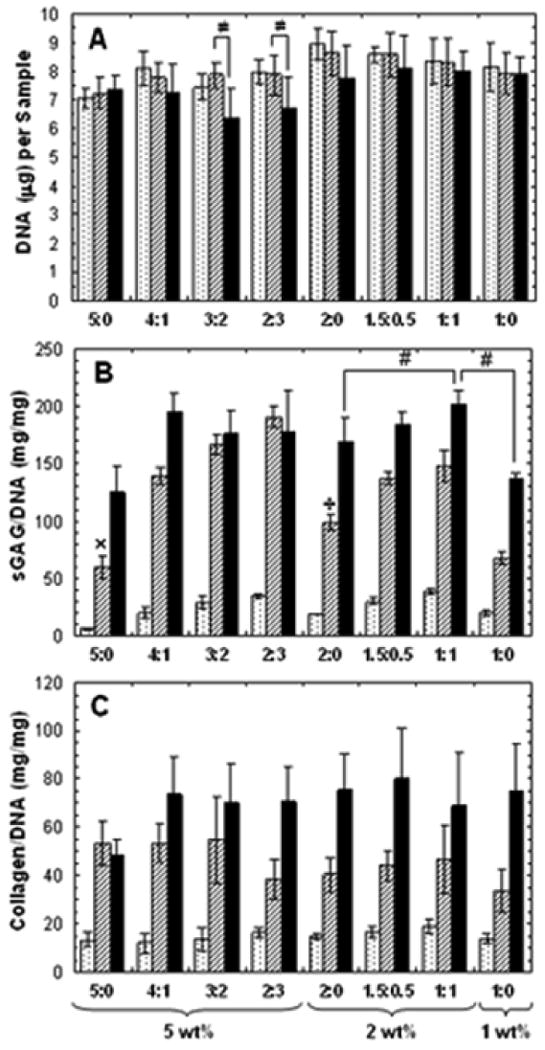
DNA (A), sulfated GAG/DNA (B), and collagen/DNA (C) contents of hydrogels at 14 (dotted), 35 (striped), and 56 (black) days of in vitro culture (n=5). Values are reported as mean ± standard deviation. Statistical analysis of relevant comparisons: * denotes significant difference between starred groups and all other groups for the specified time point, # denotes significant difference between bracketed groups, ≠ denotes significant difference over time between bracketed groups, ÷ denotes significant difference between marked group and all other 2wt% groups, and × denotes significant difference between marked group an all other 5 wt% groups. Significant increases in collagen/DNA content over time was observed for all groups (not denoted).