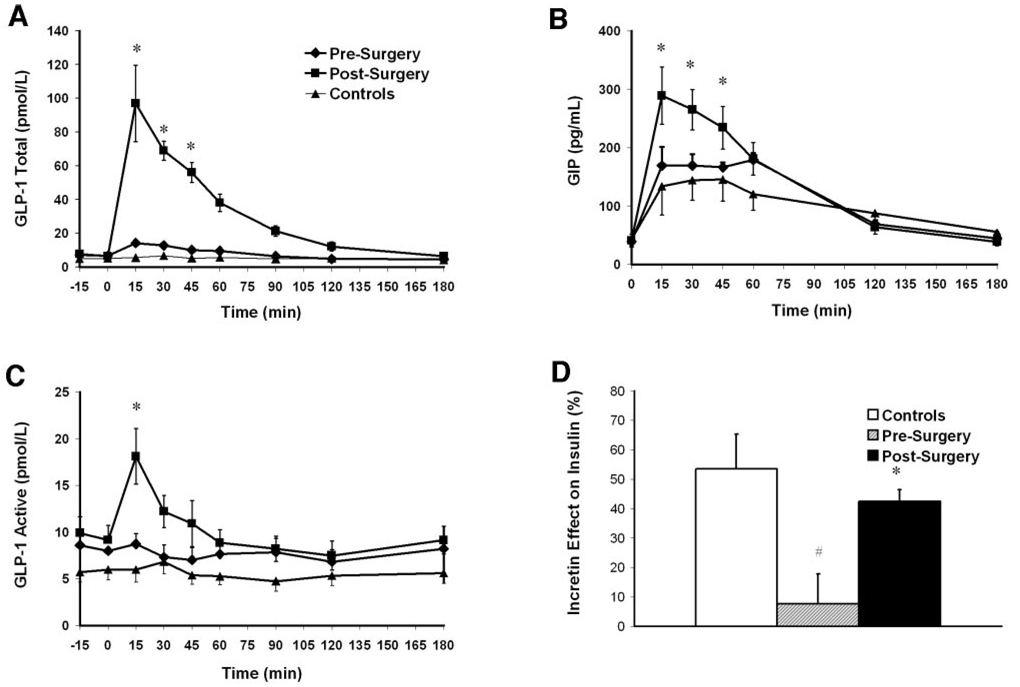
Figure 1.
Total GLP-1 (A), GIP (B), and active GLP-1 (C) levels during OGTTs in patients before (♦) and after (■) RY-GBP (A) and in control subjects (▲) and incretin effect on insulin secretion (D) in control subjects (□), patients before RY-GBP ( ), and patients after RY-GBP (■). The incretin effect was calculated by comparing the insulin response to oral and matched IV glucose loads. Data are means±SEM. *P<0.05 compared with patients before RY-GBP. #P < 0.05 compared with control subjects.

