
Fig. 4.
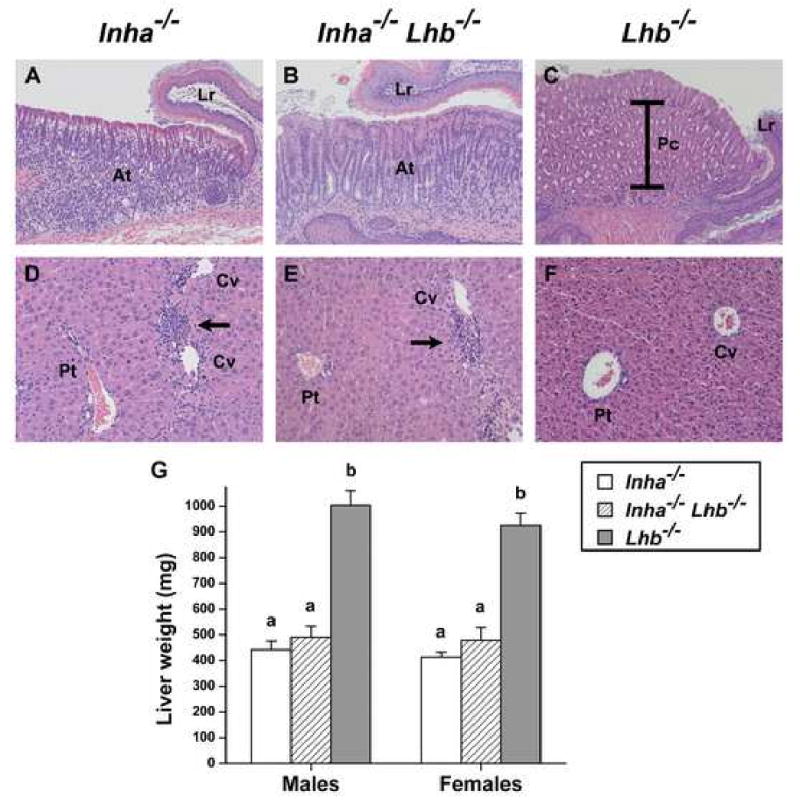
Histological analysis of stomachs (A-C) and livers (D-F) from end-stage Inha-/- and Inha-/-Lhb-/- mutants as compared to healthy Lhb-/- mice. (A-C) Glandular stomach photographed at the limiting ridge (Lr), the junction between the glandular stomach and the squamous epithelium of the forestomach. Multiple layers of large, eosinophilic parietal cells (Pc, brackets) comprise the majority of cells in the glandular region of Lhb-/- mice (C, 12 wks). In contrast, mucosal atrophy (At) and depletion of parietal cells are evident in the glandular epithelium of both Inha-/- (A, 14 wks) and Inha-/-Lhb-/- (B, 9 wks) mice. The magnification in panels A and B is 1.6-fold greater than the magnification in panel C in order to demonstrate the same region, thus indicating the severity of glandular atrophy. (D-F) Healthy liver from an Lhb-/- mouse (F, 17 wks) with portal tract (Pt) to the left and two central veins (Cv) to the right. In contrast, the livers from end-stage Inha-/- (D, 12 wks) and Inha-/-Lhb-/- (E, 27 wks) mice have lymphocytic infiltrates (arrows) around the central veins. (G) Liver weights (mean ± SEM) of end-stage Inha-/- and Inha-/-Lhb-/- males and females are similar to each other but significantly decreased compared to liver weights of Lhb-/- mice (p<0.0001, one-way ANOVA followed by Tukey's HSD test). The following numbers of end-stage mice were used to measure liver weights, with the range of ages indicated: Inha-/-, 7 males (8-28 wks) and 8 females (10-33 wks); Inha-/-Lhb-/-, 9 males (7-60 wks) and 11 females (13-35 wks); Lhb-/-, 6 males (12 wks) and 6 females (12 wks). Magnification: A, B: ×100; C: ×62.5; D, E, F: ×160.