
Figure 1.
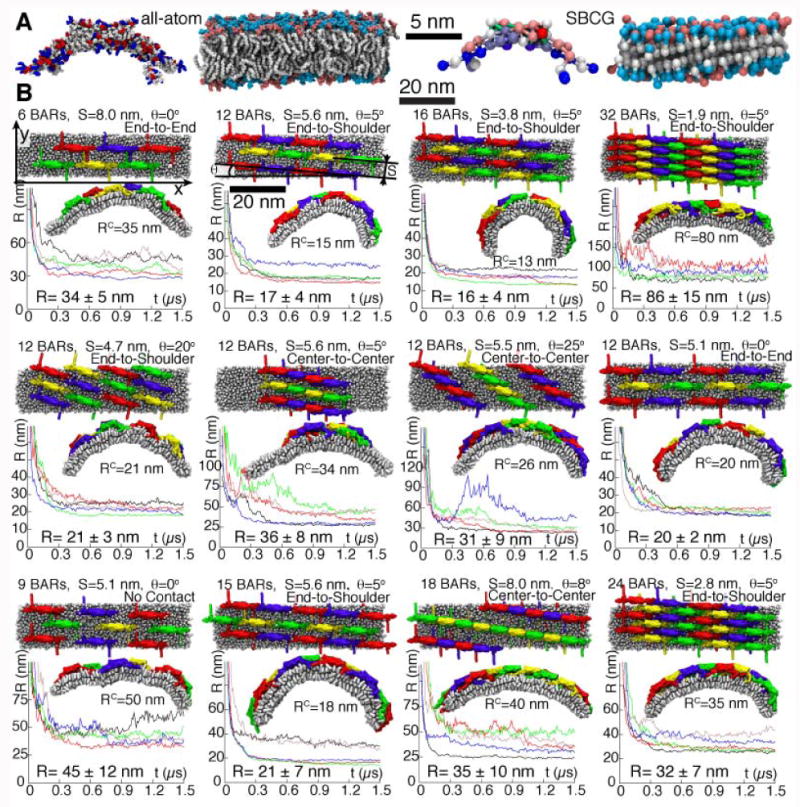
Effect of different N-BAR domain lattices on membrane curvatures. A, Comparison of all-atom and SBCG models for an N-BAR domain dimer and for a lipid membrane. The colors of beads in the SBCG protein model reflect the bead charge, on the scale from -2.4|e| (red) to +2.4|e| (blue), |e| being the elementary charge. Neutral heads are in cyan, and negative ones in pink. B, Membrane curvatures produced by various lattices of N-BAR domains. Variations in the number of N-BAR domain dimers are denoted as “6BARs”, “12BARs”, etc. Shown are distance S between rows, spiraling angle θ (between rows and the x-axis), and the contact between N-BAR domains within one row (“end-to-end”, “end-to-shoulder”, etc.). For each lattice, five independent simulations were performed; corresponding radii of membrane curvature are plotted versus time in five different colors. For each lattice, the top view of the initial configuration and the side view at t = 1.5 μs, taken from one of the five simulations, are depicted; RC is the current curvature radius for the simulation shown. The R-values are the curvature radii at t = 1.5 μs, averaged over five corresponding simulations, and shown with their respective standard deviations.