Figure 2.

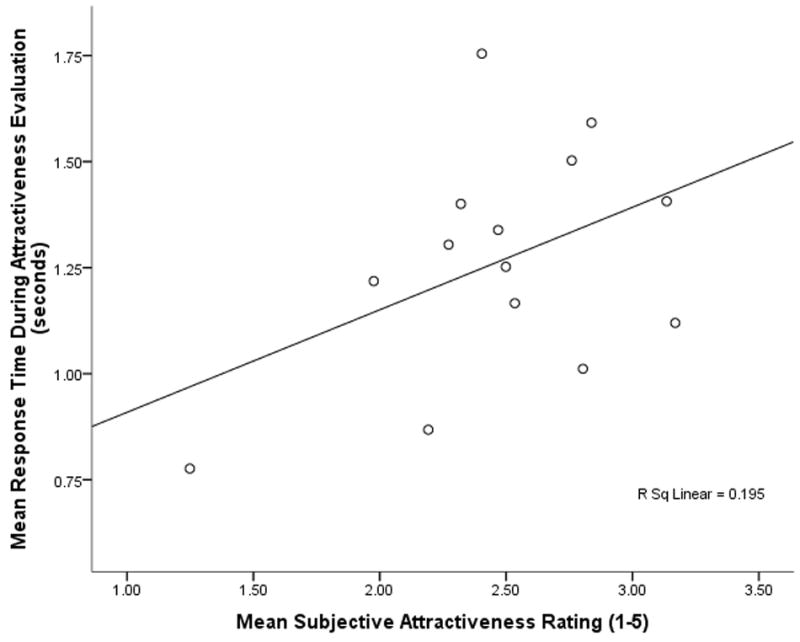
Scatterplot of women’s mean subjective evaluations of attractiveness (x-axis) with their mean response times (y-axis). Response times and ratings were significantly correlated (r = 0.44, p = 0.05).

Scatterplot of women’s mean subjective evaluations of attractiveness (x-axis) with their mean response times (y-axis). Response times and ratings were significantly correlated (r = 0.44, p = 0.05).