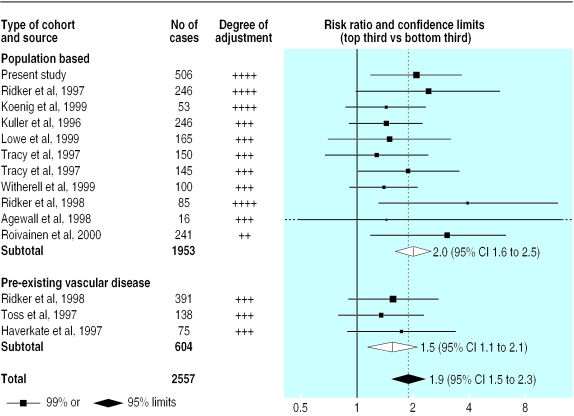
Figure 1.
Prospective studies of C reactive protein and coronary heart disease. Risk ratios compare top and bottom thirds of baseline measurements. Black squares indicate the risk ratio in each study, with the size of square proportional to number of cases. The combined risk ratio and its 95% confidence interval are indicated by unshaded diamonds for subtotals and shaded diamond for total. All studies adjusted for age, sex, smoking, and some other standard vascular risk factors; the first three studies also adjusted for markers of socioeconomic status

