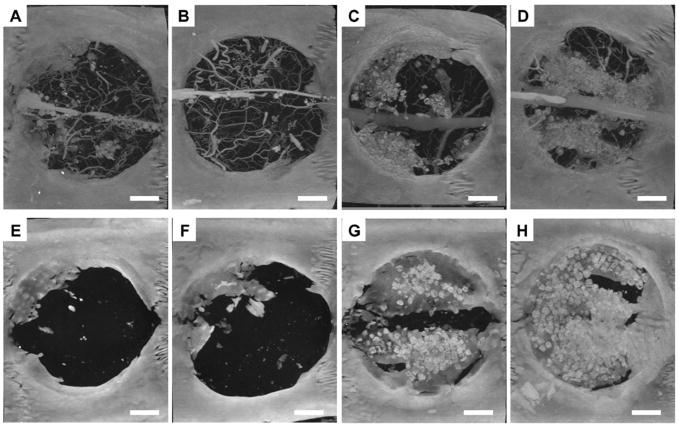
Figure 8.
Microcomputed tomography images (maximum intensity projections) of cranial defects taken at 4 and 12 weeks after implantation. Panels A-D represent scaffolds releasing no growth factor (control), VEGF, BMP-2, and both VEGF and BMP-2 respectively at 4 weeks prior to decalcification. Blood vessels were filled with a silicon based radiopaque material so that both blood vessels and mineralized tissue are visible. Panels E–H represent scaffolds releasing no growth factor (control), VEGF, BMP-2, and both VEGF and BMP-2 respectively at 12 weeks; no blood vessels were visible because perfusion with the radiopaque material was not done at this time point. Bar represents 200 μm for all panels. Scaffolds releasing both growth factors exhibited significantly greater amounts of bone-like tissue regeneration after 4 weeks but were not significantly different from scaffolds releasing BMP-2 only after 12 weeks. Reprinted with permission from (27).

