
Figure 2.
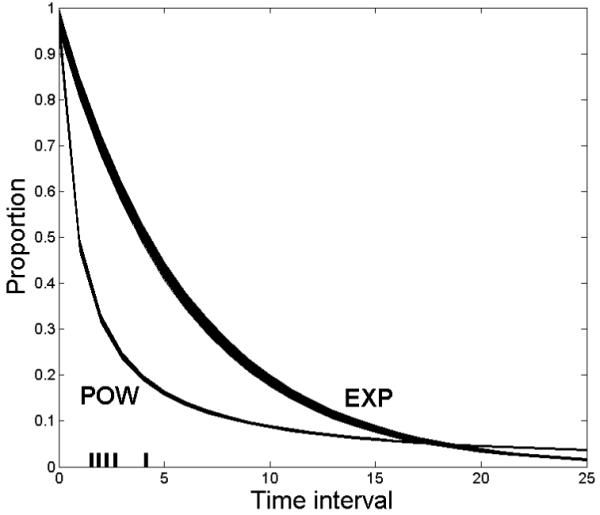
Sets of power and exponential functions when their parameters are restricted to a vary narrow range (see text). The five time intervals that optimally discriminate the two models are indicated by short vertical lines shown on the far left of the horizontal axis.