
Figure 5.
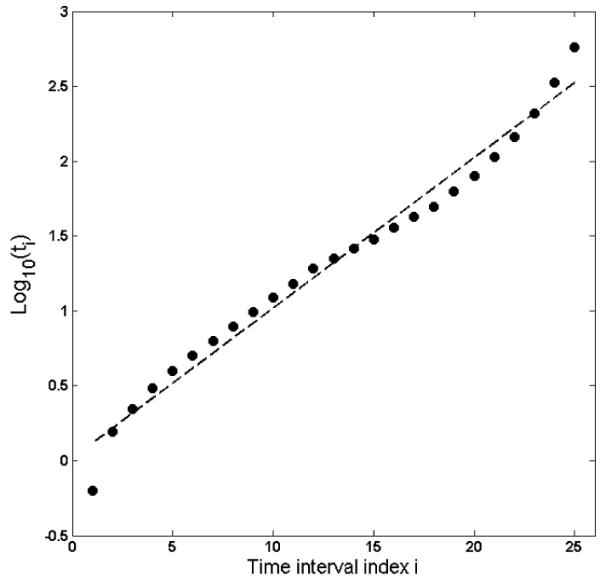
Plot of the optimal 25-point design (circles) for discriminating between the power and exponential models. The dashed line represents the best-fitting geometric design, log10(ti) = 0.014 + (0.100)i, or equivalently, ti = 1.26ti-1 with t0 =1.03, i = 1,..., 25.