
Figure 8.
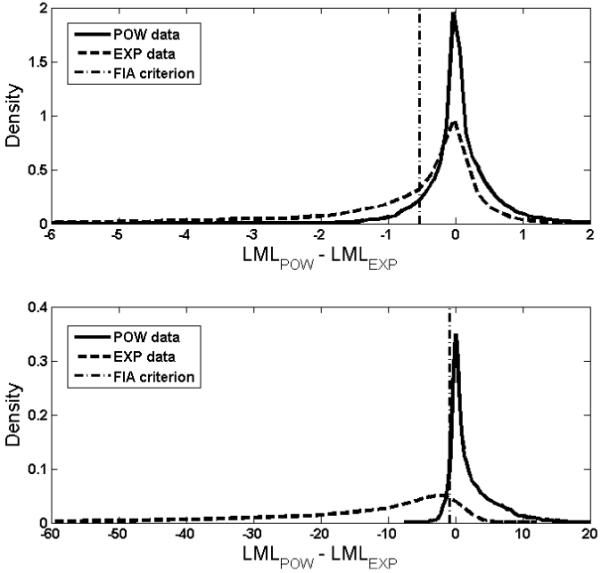
The inherent discriminability of the power and exponential models under two different designs. Graphed are the differences in log maximum likelihood (LML) of the models. The top panel shows the distributions obtained using the design T = (1, 2, 3, 4, 5). The bottom panel shows the distributions obtained using the optimal design solution T = (2.79, 9.07, 24.1, 58.6, 309). See text for details of the simulations.