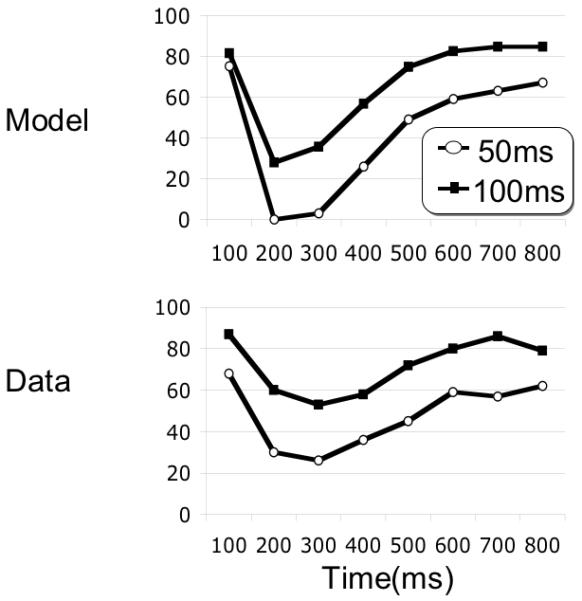
Figure 13.

Model simulation and human data for 94ms and 54ms SOA presentation rates, simulating the data published in Bowman & Wyble (2007). For the 54 ms presentation rate, lags were 2-4-6-8-10-12-14-16, producing target onset asynchronies (TOA) similar to lags 1-8 for 94 ms SOA. Critically, sparing is obtained for the lag-2 position (108 ms) in the 54ms SOA data, and the blink has the same time course. The simulation used SOA’s of 50 and 100ms in the two conditions.
