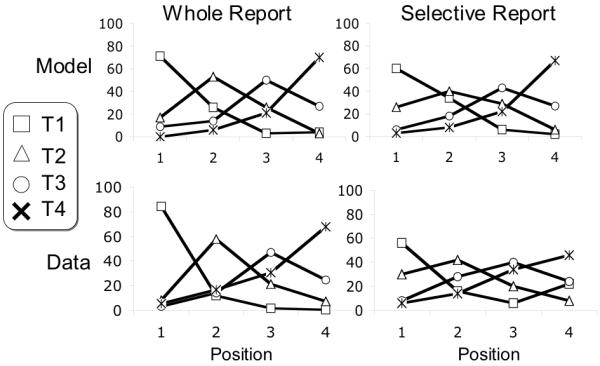
Figure 19.

Simulated and actual temporal order information for four reported targets. Whole report data (a) are from a reanalysis of the data of Nieuwenstein & Potter (2006) while selective report data are from the RB experiment reported above. In each graph are shown four lines, illustrating the frequency of reporting each target in each of the four possible positions.
