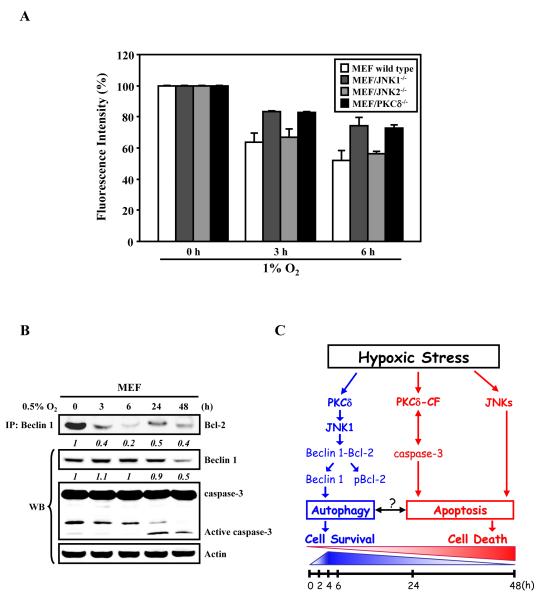
Figure 1. Hypoxic stress induces autophagy and apoptosis through PKCδ/JNK1-mediated signaling pathways.
(A) PKCδ and JNK1 are involved in hypoxia-induced degradation of GFP-LC3 fluorescence intensity via autophagy. MEF wild type, PKCδ-/-, JNK1-/-, and JNK2-/- cells were transduced by lentiviral GFP-LC3 for 24 h, followed by exposure to 1% O2 for the indicated time periods, and subsequently subjected to FACS analysis. The relative levels of GFP-LC3 intensity measured by FACS analyses were normalized to that of control cells as described in Chen et al.9 Results from at least three independent experiments are shown as relative mean ± S.D. (i.e., reported as percentage of fluorescence intensity where control level was designed as 100%). (B) Acute hypoxic stress induces autophagy through disrupting the Bcl-2 complex, whereas prolonged hypoxia induces caspase-3 activation to promote apoptotic cell death. MEF cells were exposed to 0.5% O2 for the indicated time periods. Equal amounts of whole cell lysates were subjected to immunoprecipitation with an anti-Beclin 1 antibody, followed by Western blot analyses with an anti-Bcl-2 antibody. A fraction (i.e., 5%) of total cell lysates was subjected to Western blot analyses with specific antibodies as indicated. The relative levels (numbers in italic) are calculated by normalizing observed data against their corresponding internal loading controls of actin, where the non-treatment value is set as 1. (C) A proposed model of a PKCδ/JNK1-mediated signaling pathway network that mediates autophagy and apoptosis crosstalk/switch in response to hypoxic stress. In response to acute hypoxia, PKCδ/JNK1-mediated phosphorylation of Bcl-2 results in the dissociation of the Beclin 1/Bcl-2 complex and the activation of autophagy (shown in blue). Upon prolonged hypoxic exposure, PKCδ and caspase-3 are proteolytically activated, leading to apoptotic cell death (shown in red). The schemes shown at the bottom of the figure illustrate the hypoxic exposure time frames.

