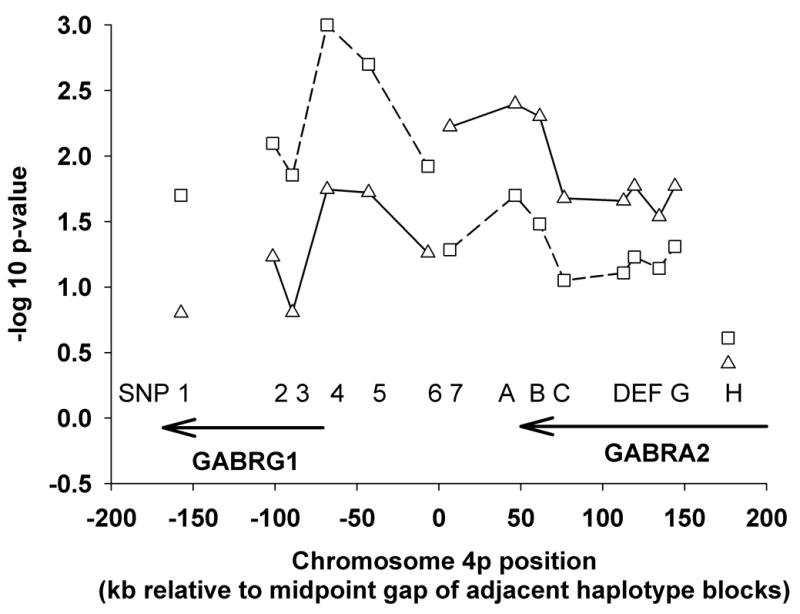
Figure 2.

Negative log10 of binary logistic regression significance (p-value) for allelic association with AD after correction for age, sex, and proportion of EA genetic ancestry among all EA subjects (1099 AD and 535 controls) as a function of GABRG1 and GABRA2 SNP location assuming additive (--□--) or dominant (–Δ–) genetic models. SNPs within each of the two haplotype blocks identified in Figure 1A for EA subjects are joined by a line. Marker positions are shown relative to the mid-point between these two haplotype blocks. Consistent with results from haplotype analysis regarding potential mode of risk transmission, individual markers in the GABRG1 haplotype block show a larger effect under an additive model while those in the GABRA2 block are more consistent with a dominant genetic effect model.
