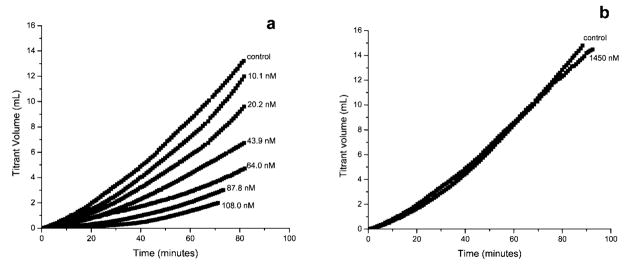
Figure 2.
CC growth curves of COM in the presence of (a) phosphorylated (PP) and (b) nonphosphorylated 14-mer OPN peptide (NPP). The relative supersaturation (σ) with respect to COM was 0.266; the pH and ionic strength were 7.00 and 0.15 M, respectively; the curves have all been normalized to a seed mass of 10.0 mg. Growth rates are calculated from the slopes of the plots of titrant volume added as a function of time during the first 15 min of reaction.

