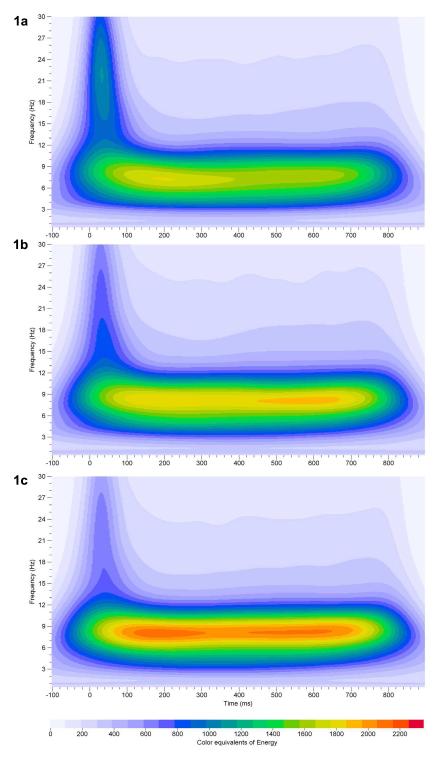
Figure 1.
Grand averages of event—related oscillations (EROs) across 64 mice recorded from frontal cortex. Time-frequency representation of evoked delta, theta and alpha/beta bands energy distribution of rare tone in three different stimulus paradigm conditions. In Fig. 1a the loudness of the rare tone was 85 dBSPL occurring 20% of the time with a frequency of 2 kHz (paradigm 3). In Fig. 1b the loudness of the rare tone was 70 dBSPL occurring 20% of the time with a frequency of 2 kHz (paradigm 1). In Fig. 1c the loudness of the rare tone was 70 dBSPL occurring 50% of the time with a frequency of 2 kHz (paradigm 2). A significant increase in the total volume in the 0-50 msec region of interest and a significant decrease in the 350-800 msec region of interest in the 7-34 Hz frequency band was found in Fig. 1a (paradigm 3), compared to Fig. 1b (paradigm 1). Comparison of the total volume of ERO regions of interest between Fig. 1b (paradigm 1) and Fig. 1c (paradigm 2) did not show statistically significant results. In each graph ERO frequency (Hz) is presented on the Y-axis, time regions of interest on the X-axis (msec) and energy is presented as color equivalents as indicated on the bar at the bottom of the graph.

