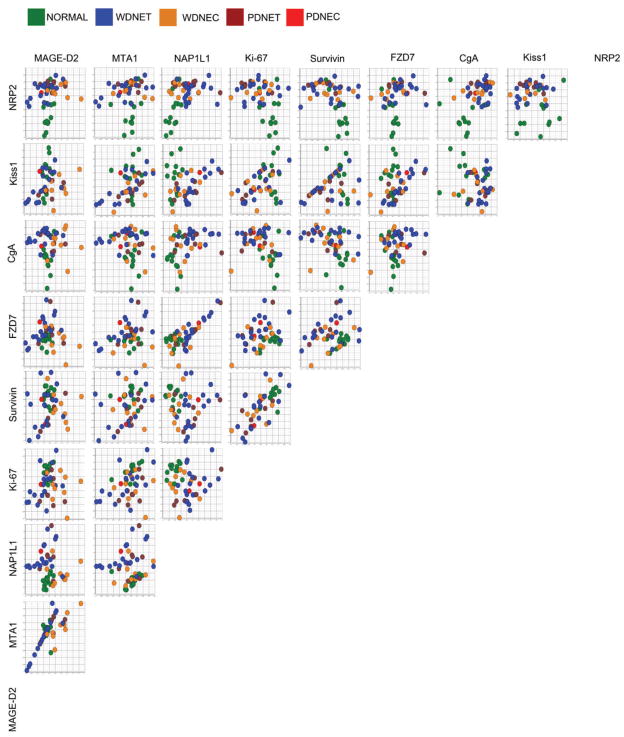
Figure 2. Similarity Matrix using Pearson Correlation of the marker gene expressions in primary Small Intestinal Neuroendocrine Tumors and normal EC cells.
Ln-normalized real-time PCR expressions of MAGE-D2, MTA1, NAP1L1, Ki-67, Survivin, FZD7, Kiss1, NRP2, and CgA were plotted onto X- and Y-axis to determine the presence or absence of linear relationships between individual gene pairs and to identify whether tumor subtype differentiation was expression-dependant. Expression levels of transcript pairs MTA1:MAGE-D2, MTA1:Kiss1, FZD7:NAP1L1, and Survivin:Ki-67 pairs were highly correlated (R2 > 0.50). Additionally, distribution of WDNETs, WDNEC, and PDNETs is linearly correlated to the expressions of Kiss1:Survivin, FZD7:NAP1L1, Survivin:MTA1, and MTA1:MAGE-D2. This suggests an expression-dependant correlation between the selected marker genes and primary tumor subtypes.

