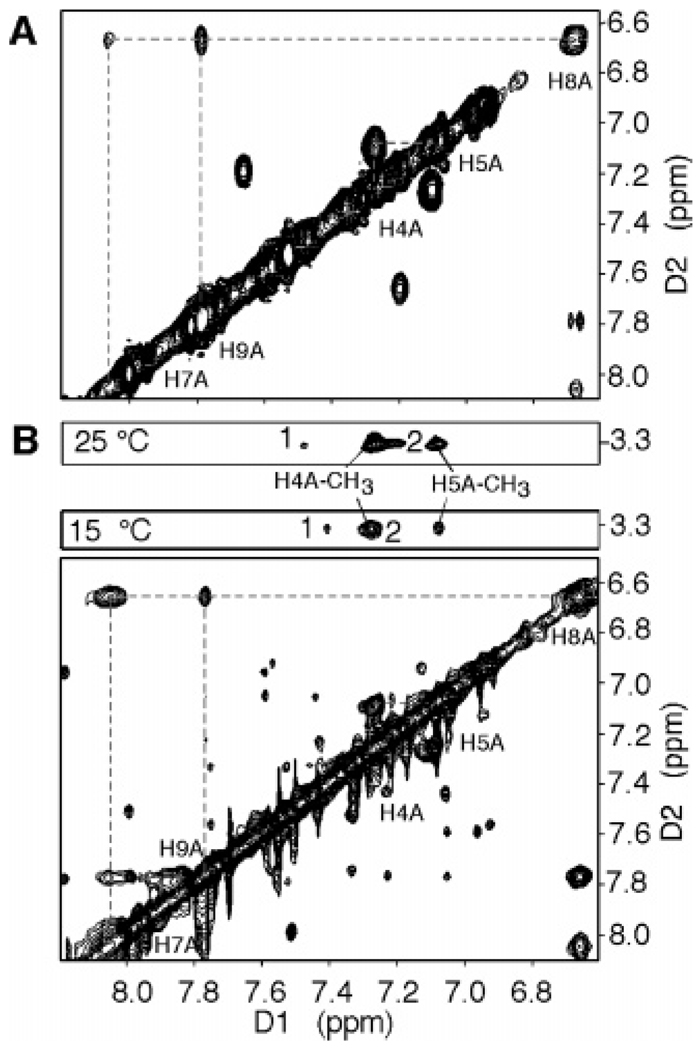
Figure 4.
Expanded plots of the COSY (A) and NOESY (B) spectra showing the IQ aromatic region of duplex 4a. The NOESY spectrum was recorded at 15 °C with the mixing time at 90 ms or 25 °C with a mixing time of 200 ms. 1 and 2 are the NOESY cross-peaks between the IQ N-CH3 group and the 3′-flanking Cyt H5 and 3′-flanking Gua H8 of the complementary strand, respectively, and are consistent with a base-displaced intercalated conformation.

