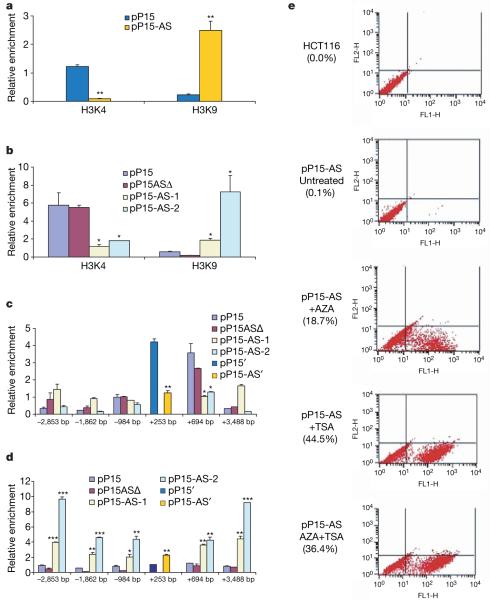
Figure 3. Heterochromatin formation induced by p15AS.
a, Antisense expression induced an increase in H3K9 dimethylation and a decrease in H3K4 dimethylation in the exogenous p15 promoter region. ChIP enrichment was measured using real-time PCR, normalized by input DNA. The endogenous and exogenous genes were distinguished with probes specific for sense (pP15′) and antisense (pP15-AS′) vectors transfected after modification by site-directed mutagenesis (see Supplementary Fig. 9). b, Antisense expression induced an increase in H3K9 dimethylation and a decrease in H3K4 dimethylation in the exogenous p15 exon 1 region. c, Antisense expression induced a decrease in H3K4 dimethylation in the proximal endogenous p15 promoter, examined by ChIP followed by realtime PCR at six locations, normalized by input DNA. The numbers on the x axis represent PCR sites relative to the transcription start site of p15. The site (+253) near the transcriptional start site was examined by vectors to distinguish endogenous and exogenous genes, as in a. d, Antisense expression induced an increase in H3K9 dimethylation in a large region (about 6 kb) of the endogenous sequence around the p15 transcriptional start site. e, Reactivation of antisense-silenced p15 promoter by 5-aza-2′-deoxycytidine (AZA) and trichostatin A (TSA). p15 promoter activity was measured by FACS for GFP after 5-aza-2′-deoxycytidine and trichostatin A treatment. The top two panels represent negative controls: HCT116 cells only and untreated HCT116 cells with pP15-AS, respectively. The bottom three panels show the result of treatment of the pP15-AS-transfected cells with either 5-aza-2′-deoxycytidine, or trichostatin A or 5-aza-2′-deoxycytidine + trichostatin A. All treatments reactivated the p15 promoter. Significant differences were tested compared with pP15 (n = 3). Error bars, s.d.; *P < 0.05; **P < 0.01; ***P < 0.001.

