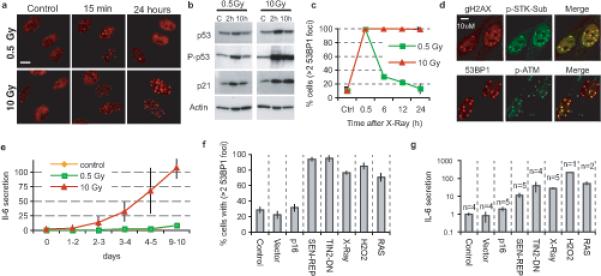
Figure 1. Persistent DNA damage signaling correlates with IL-6 secretion.

(a) HCA2 fibroblasts were untreated, irradiated with 0.5 Gy, or irradiated with 10 Gy and allowed to recover. Cells were fixed and stained for 53BP1 foci (red) at the indicated intervals after irradiation.
(b) Whole cell lysates were prepared at the indicated intervals after irradiation and analyzed by western blotting for the indicated proteins. P-p53, serine 15-phosphorylated p53.
(c) HCA2 cells were irradiated with 0.5 or 10 Gy and allowed to recover for the indicated intervals before being fixed and stained for 53BP1 foci. Nuclei with 3 or more foci were quantified.
(d) HCA2 cells were irradiated with 10 Gy and analyzed 6 d later for γ-H2AX (red) and the Ser/Thr phosphorylated ATM/ATR substrate motif (p-STK Sub; green) (top panels), or 53BP1 (red) and activated (phosphorylated) ATM (p-ATM; green) (bottom panels). The merged red and green channels display co-localization in yellow.
(e) HCA2 cells were irradiated with 0.5 or 10 Gy, and IL-6 secretion was assessed using ELISA over 10 d for the indicated 24 h windows. The data are reported as the fold increase in secretion relative to untreated control cells.
(f) Cells were infected with lentiviruses or treated as indicated (expression of p16INK4A, p16; replicative senescence, SEN-REP; telomere uncapping using a dominant-negative TIN2 protein,TIN2-DN; X-irradiation, X-Ray; hydrogen peroxide, H2O2; expression of activated RASV12, RAS). Ten days later, cells were analyzed by immunofluorescence to quantify the fraction of cells with 3 or more 53BP1 foci. For representative images of 53BP1 damage foci and for other senescence markers see Supplementary Information, Figs. S1e, S1f-I.
(g) Conditioned media from the cell populations described in Fig. 1F were collected over a 24 h interval, and analyzed for IL-6 by ELISA. The data are reported as fold increase in secretion relative to untreated control cells, and are plotted on a log scale (n= number of cell populations analyzed).
