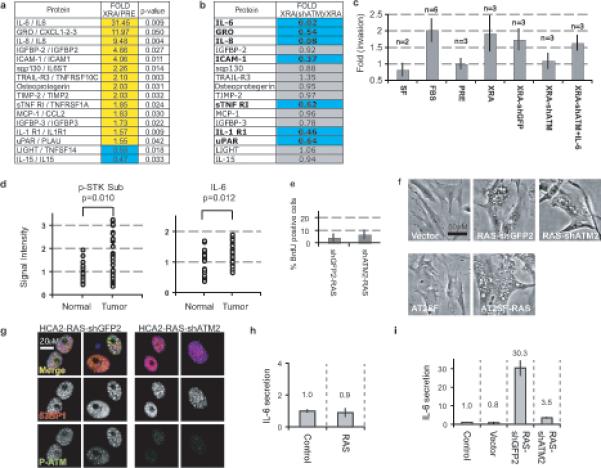
Figure 5. ATM modulates a SASP subset.

(a) Factors secreted by presenescent (PRE) or senescent HCA2 (10 d following 10 Gy) were analyzed using antibody arrays6. Signals above the PRE baseline are in yellow, signals below baseline in blue. Factors that differed significantly between PRE and XRA cells are displayed (p<0.05, student unpaired T-Test).
(b) SASP factors in (A) were analyzed in X-irradiated ATM-depleted cells (XRA(shATM)) and compared to irradiated-senescent HCA2-shGFP cells (XRA). Changes are reported as XRA(shATM) divided by XRA levels. Signals below the XRA baseline are in blue, factors not substantially modulated by ATM-deficiency in gray.
(c) T47D invasion stimulated by presenescent (PRE) HCA2 CM was given a value of 1. Compared to PRE and serum-free (SF) media, invasion was significantly (p<0.05) stimulated by 10% serum (FBS), and CM from irradiated HCA2 (XRA), HCA2-shGFP (XRA-shGFP), and HCA2-shATM plus IL-6 (XRA-shATM+IL-6), but not by CM from HCA2-shATM (XRA-shATM) (n=number of samples analyzed). Recombinant IL-6 was added to levels detected by ELISA in XRA-shGFP (3ng/ml).
(d) Human breast tissues were analyzed for ATM/ATR serine threonine kinase substrates (p-STK Sub) or IL-6 by immunofluorescence. Data are reported as arbitrary units, with the average normal signal=1 (Signal Intensity). Significance was determined by two-tailed student T-test for unpaired samples using representative fields from 21 normal and 37 cancer tissues.
(e) HCA2 cells were untreated or infected with lentiviruses expressing RAS and shRNAs against GFP (shGFP2) or ATM (shATM2), and pulsed with BrdU for 24 h 9−10 d after infection.
(f) HCA2 or A-T cells were untreated or infected as in (e) and photographed 6 d later.
(g) HCA2 cells infected as in (e) were fixed 10 d later and analyzed for 53BP1 (red), phospho-ATM (green) and DNA (DAPI, blue). Top panel=merge; bottom panels=grayscale for 53BP1 or p-ATM.
(h) A-T fibroblasts were untreated or infected as in (e). CM was collected for 24 h 9−10 d after infection and analyzed for IL-6 (fold increase relative to untreated cells; magnitude is given over the bars).
(i) HCA2 cells were untreated or infected as in (e) and IL-6 secretion analyzed as above.
