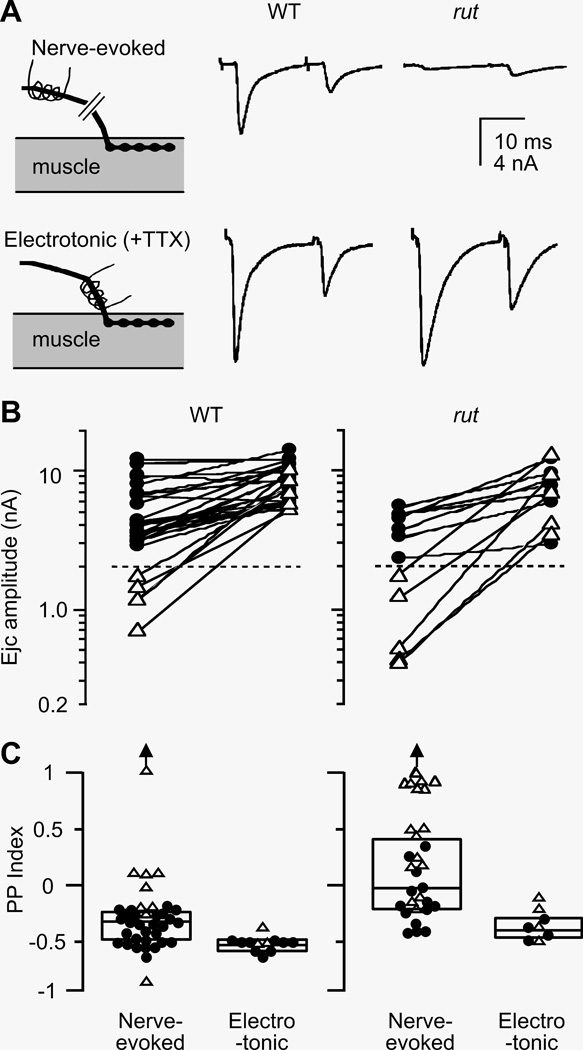
Figure 3.
Decreased synaptic variability by direct electrotonic stimulation of the nerve terminal. A. Focal ejcs evoked by nerve stimulation (upper panels) and by electrotonic stimulation of the terminal in the presence of 3 µM TTX (lower panels). In rut terminals, nerve-evoked ejcs were smaller and displayed paired pulse (PP) facilitation. When action potential invasion was by-passed by direct activation of release with electrotonic stimulation of the nerve terminal, greatly increased ejc size and PP depression was observed. In comparison, WT boutons displayed larger ejcs and PP depression. Traces represent averages of 4 – 8 trials. B. Release capability of boutons in high- and low-output terminals revealed by electrotonic stimulation. Ejcs evoked by nerve stimulation and by electrotonic stimulation from the same boutons are connected. Note that in both WT and rut, release from low-output terminals became similar to that from high-output terminals when electrotonically stimulated. C. Decreased variability in facilitation/depression by electrotonic stimulation. Boutons in rut displayed a wideranging PP index , from facilitation to depression, which became uniformly depression upon electrotonic stimulation. In contrast, WT boutons were more uniform and displayed mostly depression. The variability of PP index in WT was also decreased by electrotonic stimulation. ● and △ represent data from boutons in high- and low-output terminals, respectively (separated by dashed lines in panel B). Outliers beyond the scale are indicated by an arrow.

