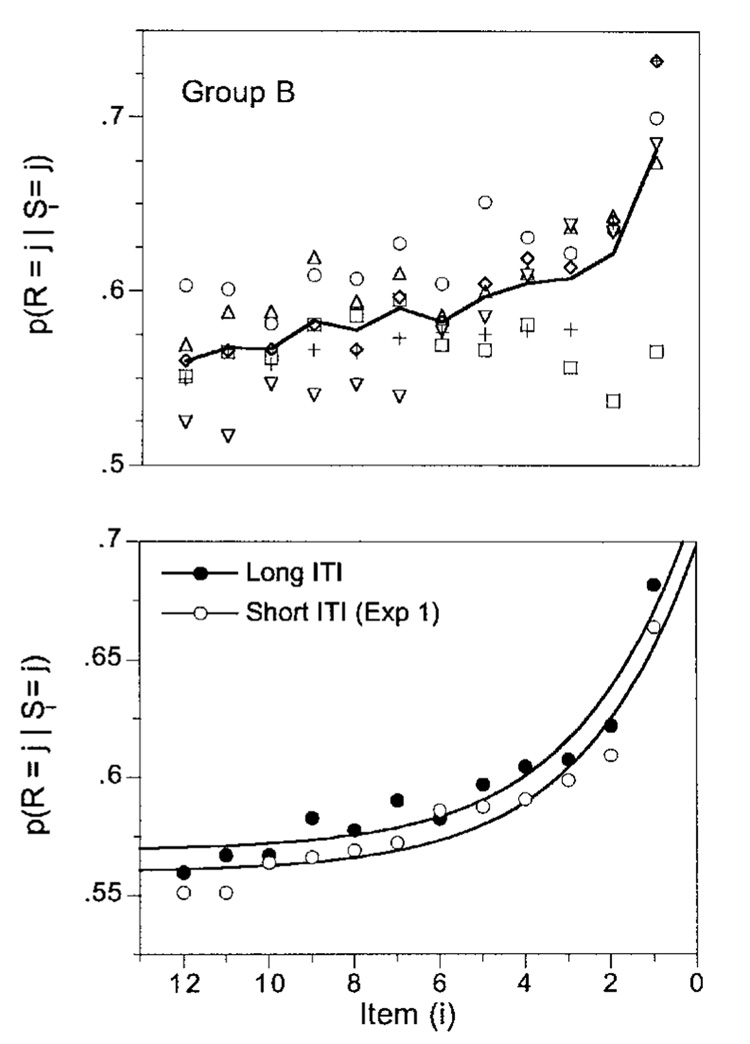
Figure 4.
The probability that the response was G (or R) given that the element in the ith position was G (or R) in Experiment 3. The curve in the top panel runs through the averages of the data; the curves in the bottom panel were drawn by Equations 1 and 2, with the filled symbols representing data from this experiment and the open symbols data from the same subjects in the baseline condition.

