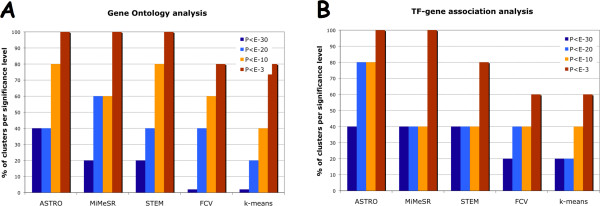
Figure 3.
Comparison of clustering approaches. Comparative analysis of clustering approaches using (A) GO data and (B) amino acid starvation ChIP-chip data. The y-axis represents the percent of clusters for which the p-value of their most significant category (GO or ChIP-chip) was lower than the given threshold.

