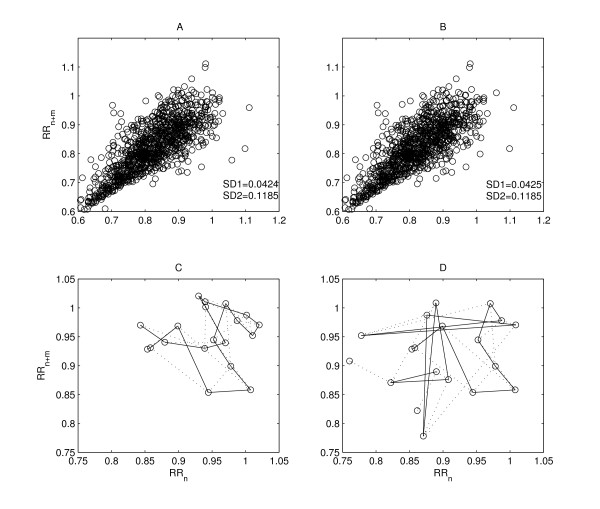
Figure 2.
Underlying temporal dynamics of a Poincaré plot. Poincaré plots with similar SD1 and SD2 values with different temporal structure are shown. Top panel (A and B) shows the Poincaré plots (lag-m = 2) of two different RR intervals series of length N (N = 1000) with SD1 (0.0424 and 0.0425) and SD2 (0.1185 and 0.1185) values. The underlying temporal dynamics of first 20 points of the same RR intervals are shown in the bottom panel (C and D), which shows the visible difference among them.

