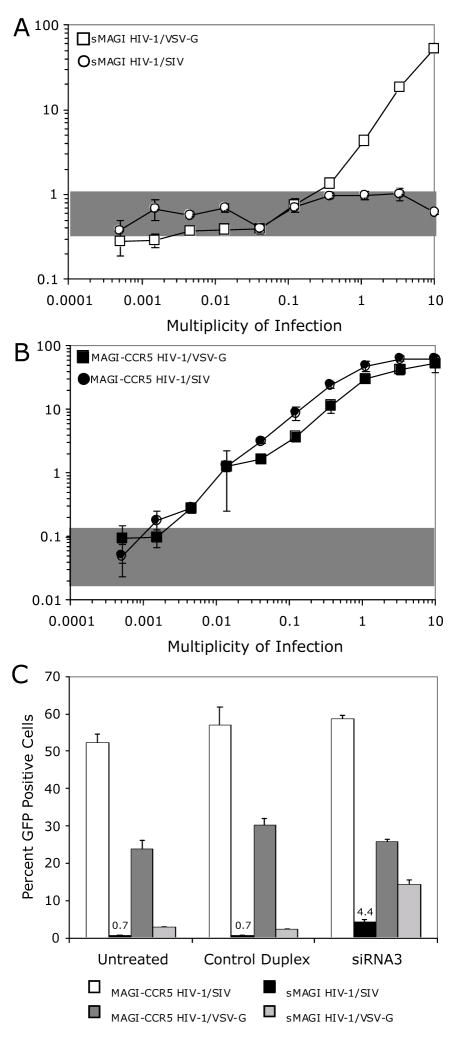
Fig. 6.
Infection of rhesus sMAGI and human MAGI-CCR5 cells with HIV-1/SIV. The percentage of GFP positive cells versus virus dose was determined by flow cytometry. Shaded regions represent the percentage of GFP positive cells detected in mock (no virus) treated cells. Error bars represent standard deviation of three replicate infections. The symbols used for various cell/virus combinations tested are shown within each panel. (A) Infection of rhesus sMAGI cells with increasing dose of HIV-1/SIV and HIV-1/VSV-G. (B) Infection of MAGI-CCR5 cells with increasing dose of HIV-1/SIV and HIV-1/VSV-G. (C) Effects ofTRIM5α-specific siRNA-treatment of sMAGI and MAGI-CCR5 cells on infection of HIV-1/SIV. Transfection of siRNA was performed as in Figure 2. In this experiment, we maintained the control HIV-1/VSV-G MOI at 1.0 but increased the MOI of HIV-1/SIV (to 2.0) to increase the likelihood that we might observe a substantial change in the percentage of HIV-1/SIV infected rhesus cells upon siRNA-mediated reduction of TRIM5α mRNA.

