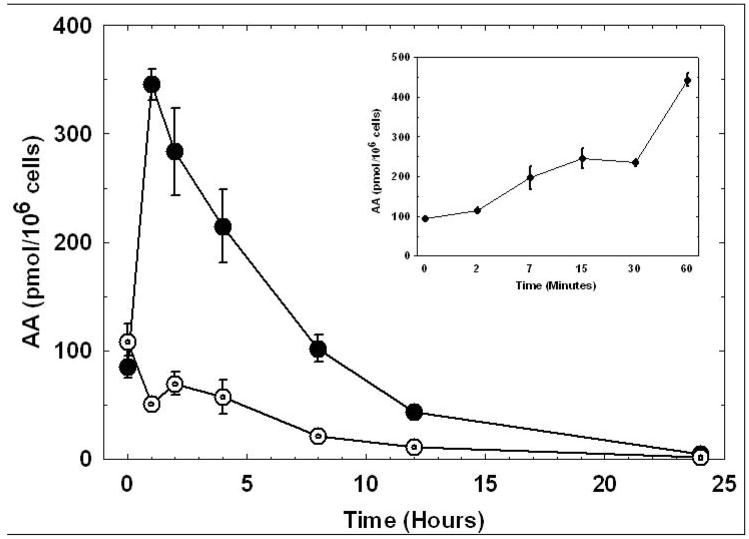
Figure 1. Kdo2-Lipid A stimulated AA release time-course.
RAW 264.7 macrophages were cultured in the presence (•) or absence (○) of 100 ng/mL Kdo2-Lipid A, the media was collected at the indicated time points and then subsequently analyzed for AA release by HPLC-MS. The insert is a separate experiment showing Kdo2–Lipid A stimulated AA release over a 60 minute time-course. A representative experiment of three individual experiments is shown. Data are expressed as mean values ± S.D. of three individual replicates.

