
Figure 4.
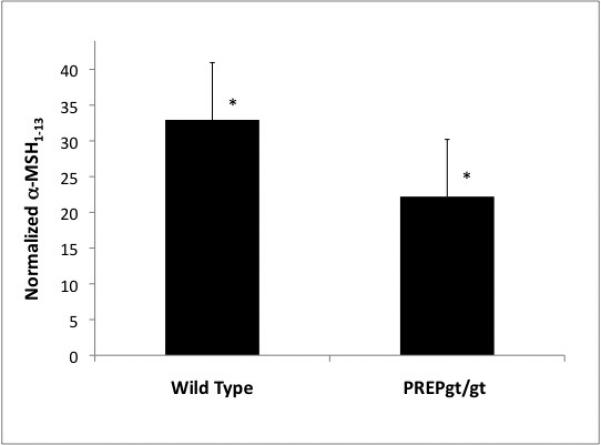
α-MSH plasma level determined by quantitative targeted proteomics. Average of MRM transitions combined peak areas shows a genotype effect. There is 1.5 fold more α-MSH in the plasma of wild-type mice (N=10) than in homozygous gene-trap mice (N=9) (Student t-test p-value = 0.0016).