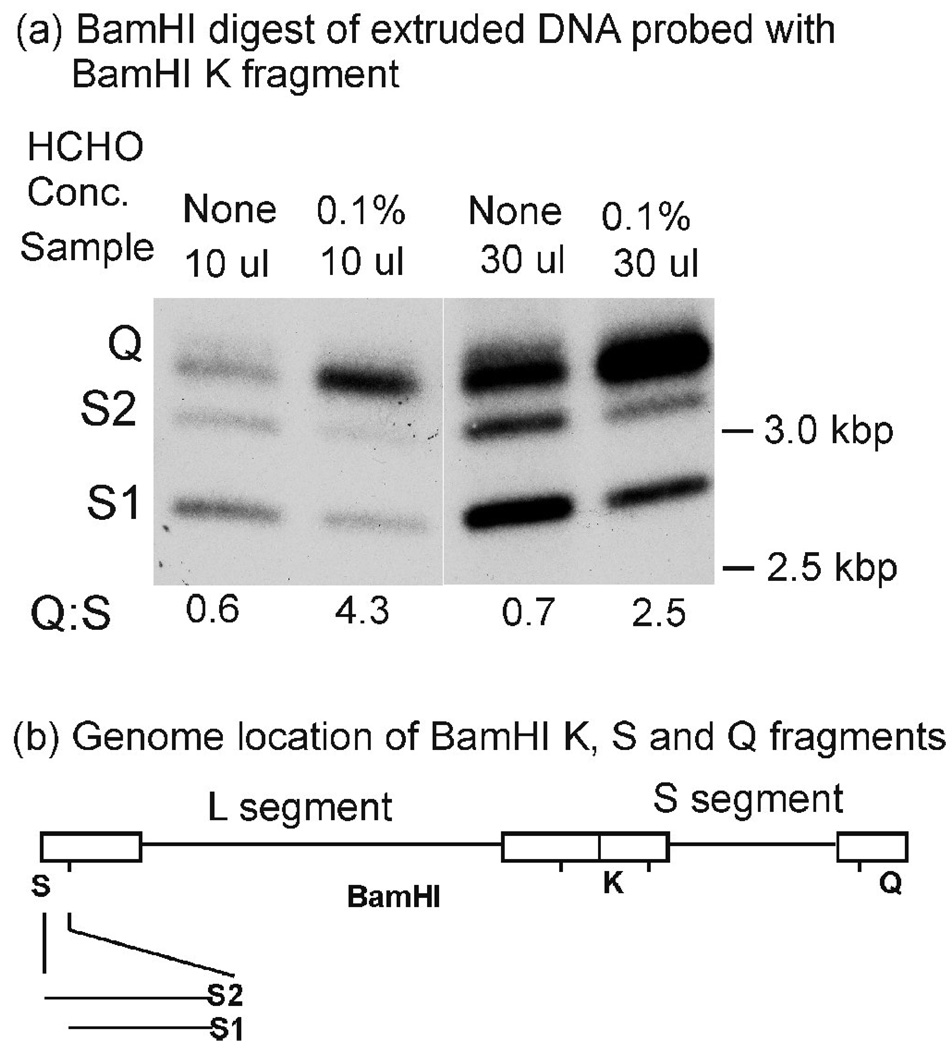
Figure 2.
Southern blot analysis of DNA extruded from control and formaldehyde-treated C capsids. As described in Materials and Methods, BamHI digests of the extruded DNA were subjected to agarose gel electrophoresis, blotting and probing with the BamHI K fragment (containing both Q and S fragments). The Q and S regions of the gel are shown in (a). Quantitative determination of the Q: S1+S2 ratio is shown below the blot. Note that Q fragments are enriched in the digests of DNA extruded from formaldehyde-treated compared to control capsids. The genomic locations of BamHI Q (3.4 kbp), S (S1: 2.9 kbp; S2 3.3 kbp) and K (6.1 kbp) fragments are shown in (b). S1 and S2 differ in the number of a sequences present; S1 has one and S2 has two.53

