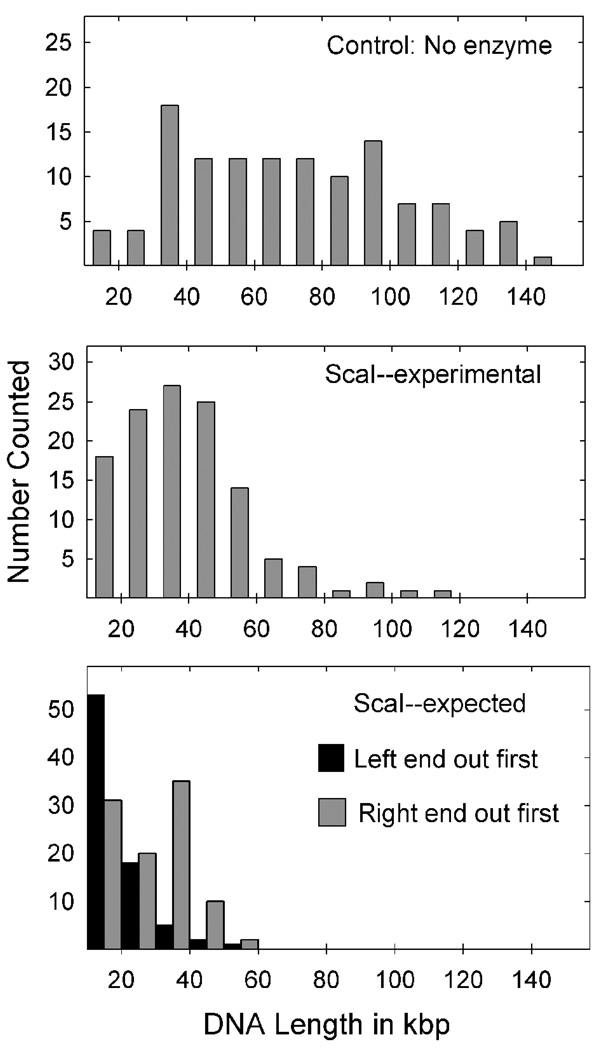
Figure 5.
Histograms showing the extruded DNA lengths measured in flow chamber experiments from capsids in control (top) and ScaI-treated preparations (middle panel). Measurements were made from micrographs recorded in experiments identical to those shown in Fig. 4. Measured DNA lengths were converted to number of base pairs as described in Materials and Methods. The bottom panel shows the predicted distribution of DNA lengths after ScaI digestion assuming DNA was ejected beginning at the left (black) and right (gray) genome ends. Note that the experimentally-determined length distribution (middle panel) corresponds better to the distribution expected from extrusion beginning at the right end.

