Figure 3.

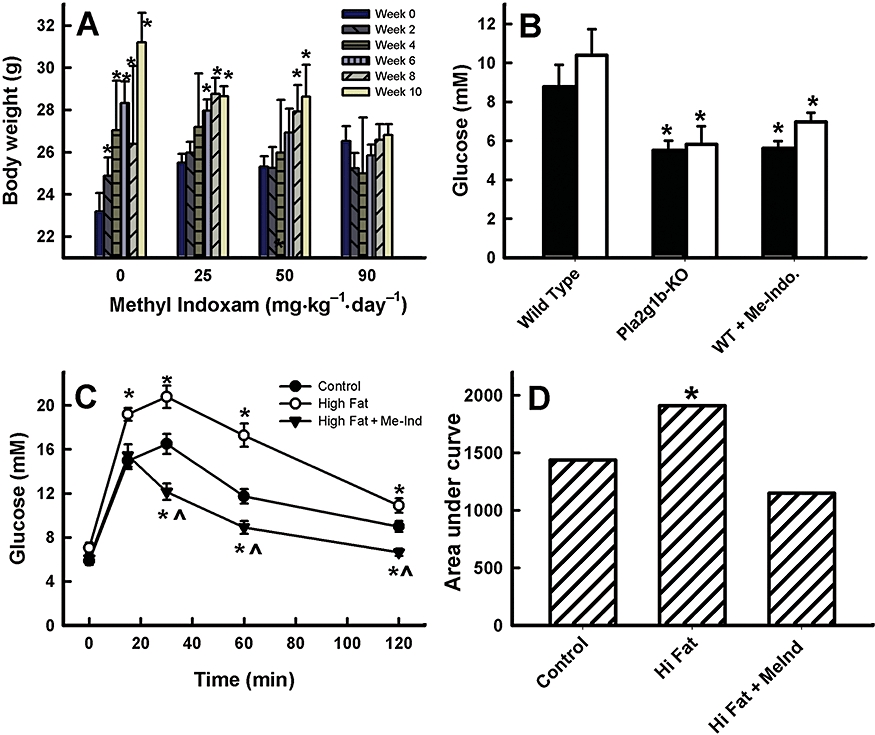
Methyl indoxam suppressed diet-induced obesity and hyperglycaemia in mice. (A) The effect of various doses of methyl indoxam treatment on body weights of mice fed the high-fat/high-carbohydrate diabetogenic diet. Body weights were recorded at 2 week intervals as shown (left to the right bars with each dose of methyl indoxam). *Denotes significant difference from the body weight at week 0 for the same group of mice. (B) Fasting blood glucose levels in wild-type mice fed a diabetogenic diet without inhibitor or with 90 mg·kg−1 methyl indoxam (WT + Me-Indo) and in Pla2g1b−/− (Pla2g1b-ko) mice after 4 (solid columns) and 10 (open columns) weeks. *Denotes significant difference from wild-type control mice at P < 0.05. (C) Glucose tolerance test results after i.p. injection of glucose (2 g·kg−1) into wild-type C57BL/6 mice maintained on control low-fat diet, or high-fat diet without or with 90 mg·kg−1 methyl indoxam treatment for 10 weeks. *Denotes significant difference from wild-type control mice at P < 0.05 and indicates significant difference from the high fat-fed group at P < 0.01. (D) The area under the curve analysis of the glucose tolerance test data presented in (C). *Denotes significant difference from wild-type control mice at P < 0.05. All data are presented as mean ± SD from eight mice in each group.
