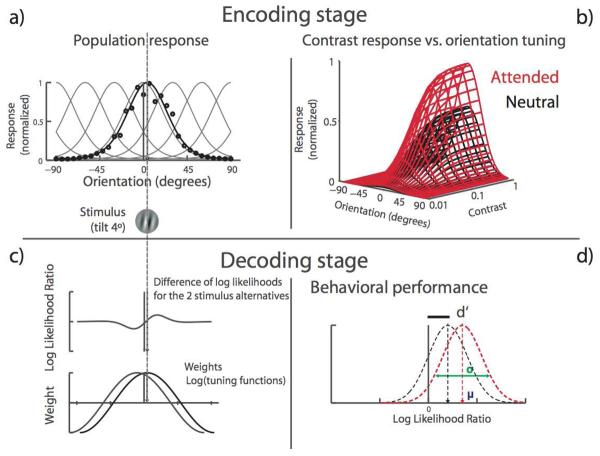
Figure 2. Population-coding model for orientation discrimination with contrast-dependent responses.
The model is composed of an encoding front stage and a decoding back stage. It predicts the likelihood that a stimulus gives rise to the neural population response by computing the weighted sum of individual neurons' responses. The encoding stage is a bank of orientation-tuned neurons, modeled as circular normal (a, equation 2). To generate a population response (black line), the response of each neuron (black dots), given by the individual tuning curves (gray lines) is scaled by the population's sensitivity to contrast, as described by a Naka-Rushton function (b, equation 4). The decoding stage computes the likelihood of each stimulus alternative and uses their log-likelihood ratio to choose the most likely one. Each neuron's contribution to the decision is determined by the product of its firing rate (resulting from its orientation-tuning and contrast-response properties) and the log of its tuning curve (equation 5). Neurons' responses are signal-correlated, such that response correlation varies as a function of tuning similarity (c, equation 3). Sensitivity (d′) is computed by estimating the most likely stimulus alternative. The model reaches a decision by computing the mean likelihood-ratio of the two possible alternatives (+4° and −4°) and the variance around this mean (d, equations 7-10).

