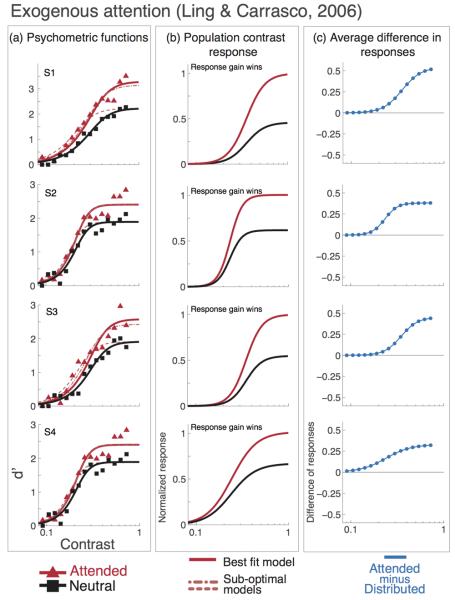
Figure 5. Exogenous attention. Psychometric functions, data and model predictions from Ling & Carrasco (2006).
Individual observer data, model fits and attentional effect. Black lines and squares represent the neutral-attention condition, red lines and triangles represent the exogenous attention condition. Short-dash lines show the best fit for the mixed model (contrast gain plus response gain), long-dash lines show the best fit for the response gain model. a) Data and psychometric functions estimated by the model. b) Estimated contrast response functions. c) Difference in response between neutral- and exogenous-attention conditions. The best model for exogenous attention is response gain; the effect of attention on the pCRF increases with contrast (b) and the difference in population response is highest at high contrast (c).

