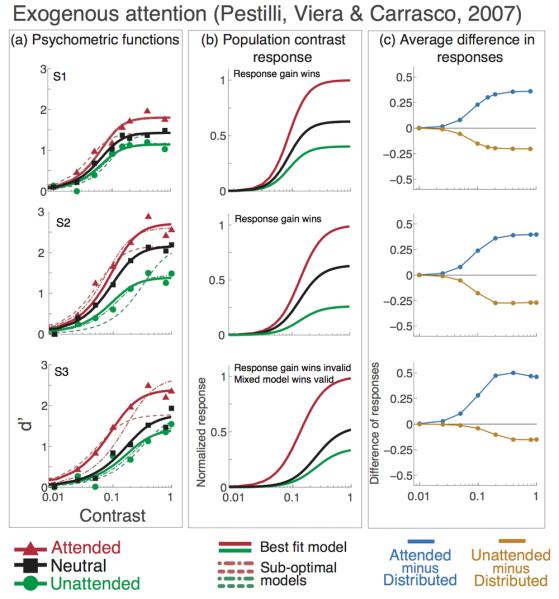
Figure 6. Exogenous attention. Psychometric functions, data and model predictions from Pestilli, Viera, & Carrasco (2007).

Individual observer data, model fits and attentional effect. Black lines and squares represent the neutral-attention condition, red lines and triangles represent the valid-cue exogenous attention condition. Green lines and circles represent the invalid-cue exogenous attention condition. Short-dash lines show the best fit for the mixed model (contrast gain plus response gain), long-dash lines show the best fit for the response gain model. a) Data and psychometric functions estimated by the model. b) Estimated contrast response functions. c) Difference in response between neutral- and valid-cues (light blue) and neutral- and invalid-cues (gold) conditions. A positive or negative value means that there is an increase or decrease in response, respectively, when attention is directed to a stimulus, as compared to the neutral cue condition in which attention is directed to both locations. The best model for exogenous attention is response gain; the effect of attention on the pCRF increases with contrast (b), response is higher for attended and lower for unattended stimuli) and the difference in population response is highest at high contrast for attended stimuli and lowest at high contrast for unattended stimuli (c).
