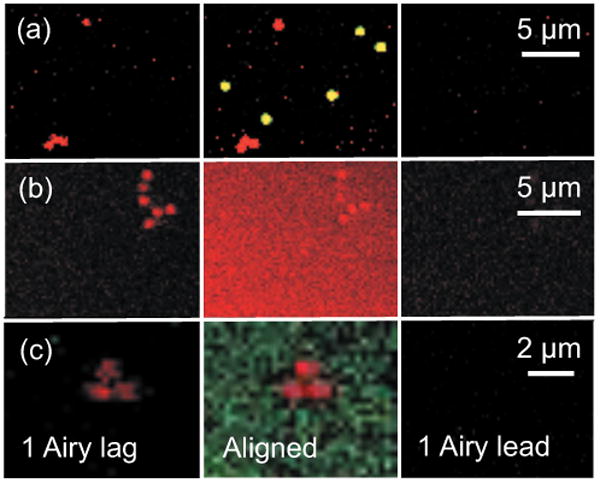
Fig. 2.

Confocal images of long-lifetime europium microspheres and short-lifetime green microspheres, rhodamine, and fluorescein. In (a), 1-μm europium microspheres were imaged with 1-μm green microspheres. In (b), europium microspheres were imaged with rhodamine (400 μM) in solution. In (c), europium microspheres were imaged with fluorescein (400 μM) in solution. The center column shows images obtained with the pinholes aligned to the laser spot. The left column shows images obtained with pinholes shifted in the lagging direction relative the rasting laser spot by 1 Airy unit. The right column shows images obtained with pinholes shifted by 1 Airy unit in the leading direction. Laser power was 13% in (a) and (c) and 20% in (b). Dwell time was 102 μs for (a) and (b) and 204 μs for (c).
