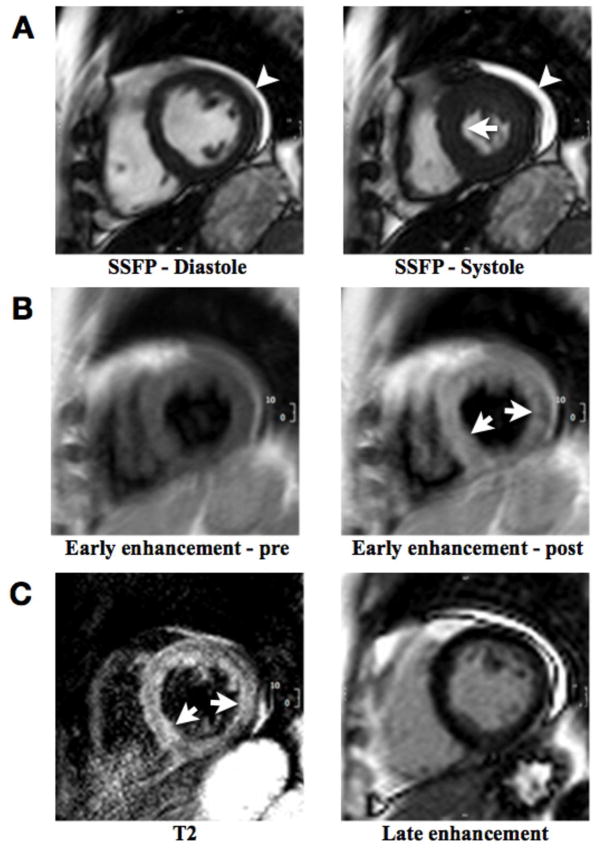
Figure 1. Short axis CMR views in a patient with clinically acute myocarditis.
A: Still frames from a cine series at end-diastole (left) and end-systole (right), showing only very mild septal hypokinesis (arrow) with preserved ejection fraction. Small pericardial effusion is present along the lateral segments (arrowhead). These findings represent two supportive criteria for myocarditis.
B: T1-weighted spin echo images before (left) and shortly after (right) gadolinium administration with early gadolinium accumulation in the septum (arrows). Quantitative evaluation of the signal enhancement (skeletal-muscle normalized myocardial enhancement ratio of equal to or greater than 4.0 or an absolute enhancement of equal to or greater than 45%) is required to use information from this pulse sequence as a positive criterion.
C: Left: T2-weighted spin echo image with high signal intensity of the septum and lateral wall (arrows). Evidence for regional edema, or a signal intensity ratio of equal to or greater than 2.0 (signal intensity normalized to skeletal muscle in the same slice) renders T2 findings positive. Right: Late enhancement image without evidence for significant delay of gadolinium washout. The thin subepicardial layer of high signal intensity in the inferolateral region represents fat.

