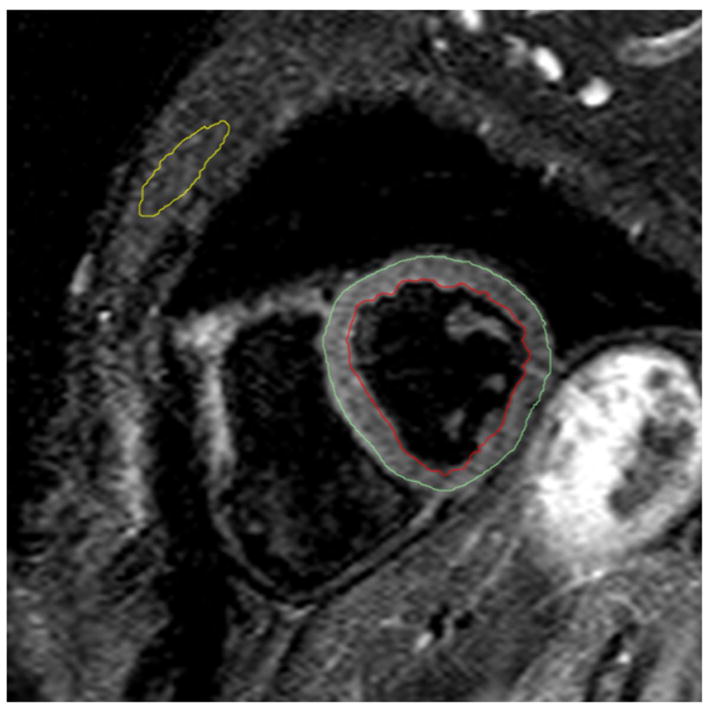
Figure 3. Signal intensity analysis contours for tissue characterization.
T2-weighted image in a short axis orientation with example contours for skeletal muscle (yellow), subepicardial border (green) and subendocardial border (red). The contour for the skeletal muscle was copied from a mid-diastolic SSFP still frame in the same slice position.

