
Figure 2. PSA-specific CD8 T cell response to PSA-expressing TRAMP tumor cells in HLA-DR2bxB6 F1 mice.
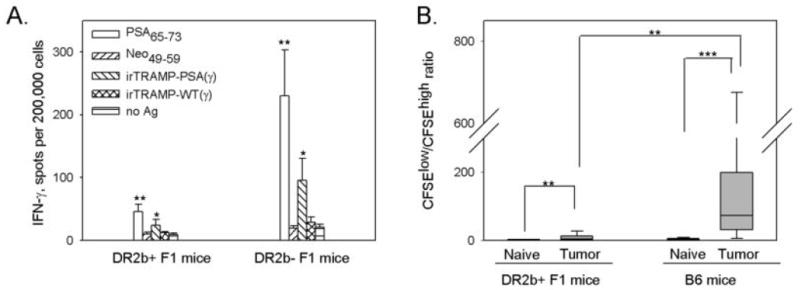
(A) HLA-DR2b+ or HLA-DR2b- F1 mice were inoculated s.c. with TRAMP-PSA tumor cells. Spleens were harvested two weeks later, and frequencies of IFN-γ secreting cells were estimated by ELISPOT assay as described in Materials and Methods. Lymphocytes from 5 mice per group were tested individually in triplicates, mean ± SE was calculated for each group. Combined data from two independent experiments with similar trend are shown. (B) HLA-DR2b+ F1 or wild type B6 mice were inoculated s.c. with TRAMP-PSA tumor cells. Two weeks later, tumor-bearing and syngeneic naïve animals were injected i.v. with CFSE-labeled target cells. A mixture consisted of equal numbers (10×106 each per mouse) of CFSEhigh cells pulsed with PSA65-73 peptide and CFSElow untreated cells. Spleens were removed 16 hr later, and analyzed for the loss of CFSEhigh population by flow cytometry. CFSElow/CFSEhigh ratios are presented as a box plot, the boundaries of the box show the 5th/95th percentile, a line within the box marks the median. Combined data from three independent experiments with similar trend are shown (total 9 mice per group).
* p<0.05, ** p<0.01, *** p<0.001 (two-tailed Mann-Whitney U-test).