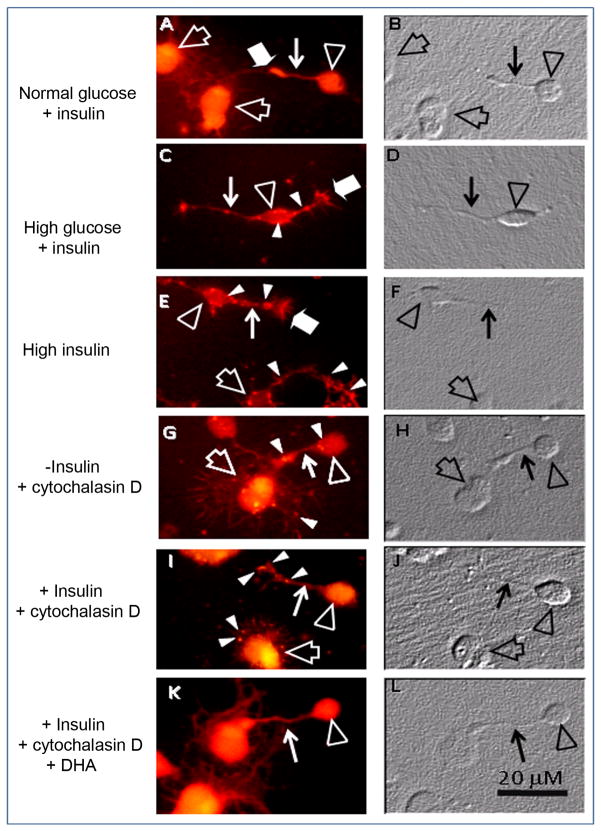
Figure 4.
Effects of high glucose, high insulin and cytochalasin D on actin cytoskeleton in photoreceptors. Phase (B, D, F, H, J, L) and fluorescence (A, C, E, G, I, K) photomicrographs, showing actin labeling of 3 day neuronal cultures in control conditions (A, B, 5.5 mM glucose, 1.66μM insulin), with high glucose (C, D, 25 mM glucose, 1.66 μM insulin) or with high insulin (E, F, 5.5 mM glucose, 16.6μM insulin) and of cultures without (G, H) and with (I, J) insulin or with insulin and DHA (K, L), treated at day 3 with 2 μM cytochalasin D for 30 min. In controls (A, B), photoreceptors (open arrowheads) and amacrine neurons (open arrows) showed a uniform, filamentous actin labeling in neurites (thin white arrows) and cell bodies. High glucose and high insulin led to the formation of actin clumps in photoreceptor cell bodies, axon cones and neurites (white arrowheads in C, E) and of actin spikes that protruded from growth cones (wide white arrows in C, E). In insulin-lacking cultures (G), cytochalasin D disorganized the actin network, with actin clumps being visible in photoreceptor neurites and cell bodies and in amacrine neuron lamellipodia (white arrowheads in G); the loss of actin staining is clearly observed in amacrine lamellipodia (open arrow in G). Insulin slightly prevented cytochalasin effects, though actin clumps were still evident (white arrowheads in I). The combined addition of DHA and insulin preserved a normal actin cytoskeleton in photoreceptor cell bodies and neurites (thin white arrow in K).

